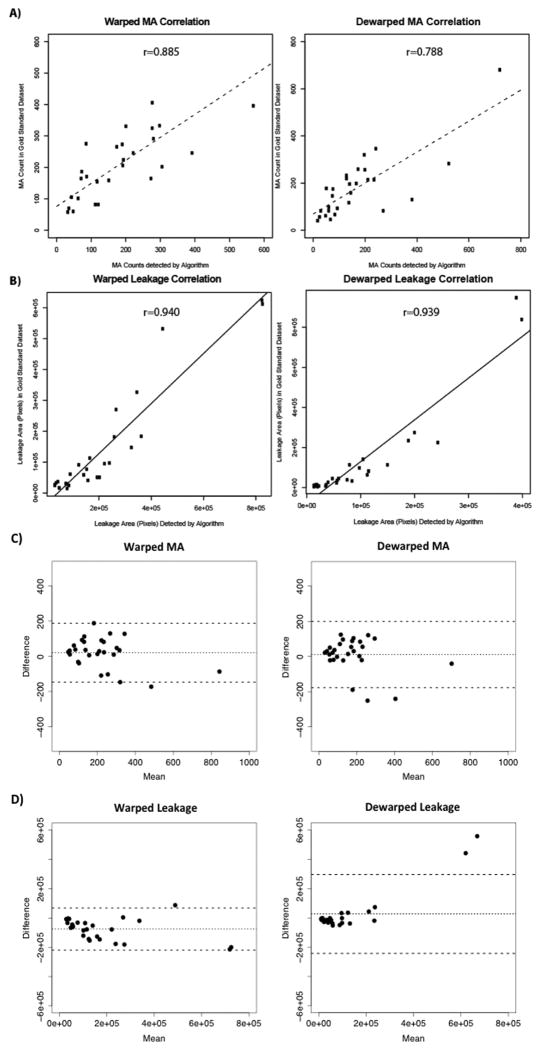
Figure 5. Comparison of algorithm detection to expert reader gold standard identification of pathologic features.
Correlation of A) MA counts and B) leakage areas segmented by algorithm and gold standard. Leakage areas were measured in pixels. Lines represent line of best fit by linear regression. Bland-Altman plots of C) MA and D) leakage comparing manual segmentation to automated segmentation.

