
Fig. 6.
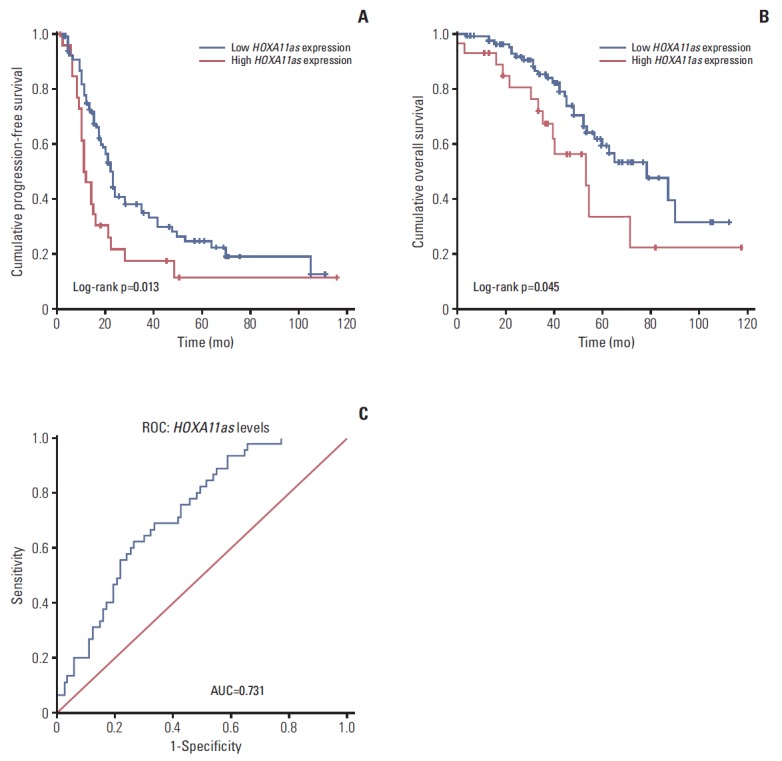
Correlation of HOXA11 antisense (HOXA11as) expression with patient survival. Kaplan-Meier curves for progression- free survival (A) and overall survival (B) in serous ovarian cancer patients with different expression levels of HOXA11as. (C) Receiver operating characteristic (ROC) curve for prognosis prediction of patients using HOXA11as level. The area under curve (AUC) is shown in plots.