
Figure 3. LATS1/2 Deficiency in Tumor Cells Induces Host Anti-tumor Immunity.
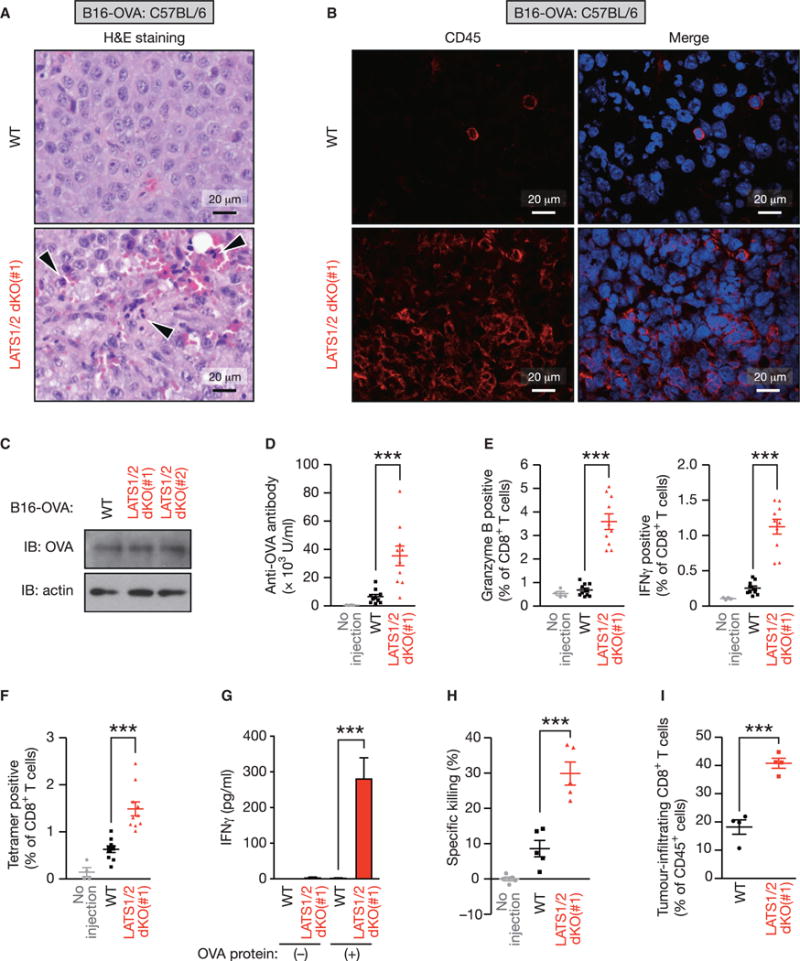
(A) WT or LATS1/2 dKO B16-OVA melanoma cells were injected into C57BL/6 mice. Tumors were paraffin embedded and stained with H&E 12 days after transplantation. Arrowheads indicate infiltration of inflammatory cells.
(B) Frozen sections from WT or LATS1/2 dKO B16-OVA melanomas were subjected to immunostaining analysis of CD45 (red) along with DAPI for DNA (blue).
(C) WT and two independent clones of LATS1/2 dKO B16-OVA melanoma cells were subjected to immunoblot (IB) analysis with antibodies to the indicated proteins.
(D–F) In (D), C57BL/6 mice were injected (or not injected) with WT or LATS1/2 dKO B16-OVA melanoma cells, and serum anti-OVA IgG concentrations were determined by ELISA 12 days after transplantation. (E) Splenocytes from C57BL/6 mice injected as in (D) were re-stimulated ex vivo with SIINFEKL peptide and then subjected to flow-cytometric analysis. SIINFEKL is an OVA-derived peptide being presented through the major histocompatibility complex class I (MHC class I) molecule H-2Kb. Frequency of CD8+ T cells expressing activation markers, Granzyme B or interferon γ (IFNγ), was determined. (F) Splenocytes from C57BL/6 mice injected as in (D) were subjected to flow-cytometric analysis. OVA-specific CD8+ T cells were quantified using Kb-SIINFEKL tetramers and plotted as a percentage of total CD8+ T cells. Data are presented as means ± SEM; n = 4 mice for the uninjected group, n = 10 mice for the WT-injected group, and n = 10 mice for the LATS1/2 dKO-injected group. ***p < 0.001, one-way ANOVA test followed by Tukey’s multiple comparison test.
(G) C57BL/6 mice were injected as in (D), and the inguinal lymph nodes were cultured ex vivo with OVA protein. IFNγ levels in the culture supernatants were determined by ELISA. Data are presented as means ± SEM of triplicate cultures of pooled lymph node cells from 4 mice per group. ***p < 0.001, one-way ANOVA test followed by Tukey’s multiple comparison test.
(H) C57BL/6 mice were injected as in (D) and CD8+ T cells were isolated from splenocytes. T cell cytotoxicity assay was performed with CFSE (carboxyfluorescein succinimidyl ester)-labeled EL4 cells ex vivo and the percentage of specific killing was plotted. Data are presented as means ± SEM of five independent experiments with pooled CD8+ T cells from 3–4 mice per group. ***p < 0.001, one-way ANOVA test followed by Tukey’s multiple comparison test.
(I) WT or LATS1/2 dKO B16-OVA melanoma cells were injected into C57BL/6 mice, and tumors were subjected to flow-cytometric analysis 12 days after transplantation. Data are presented as means ± SEM of the percentage of CD8+ T cells infiltrating into tumors among total CD45+ cells; n = 4 tumors for each group. ***p < 0.001, unpaired t test. See also Figure S3.