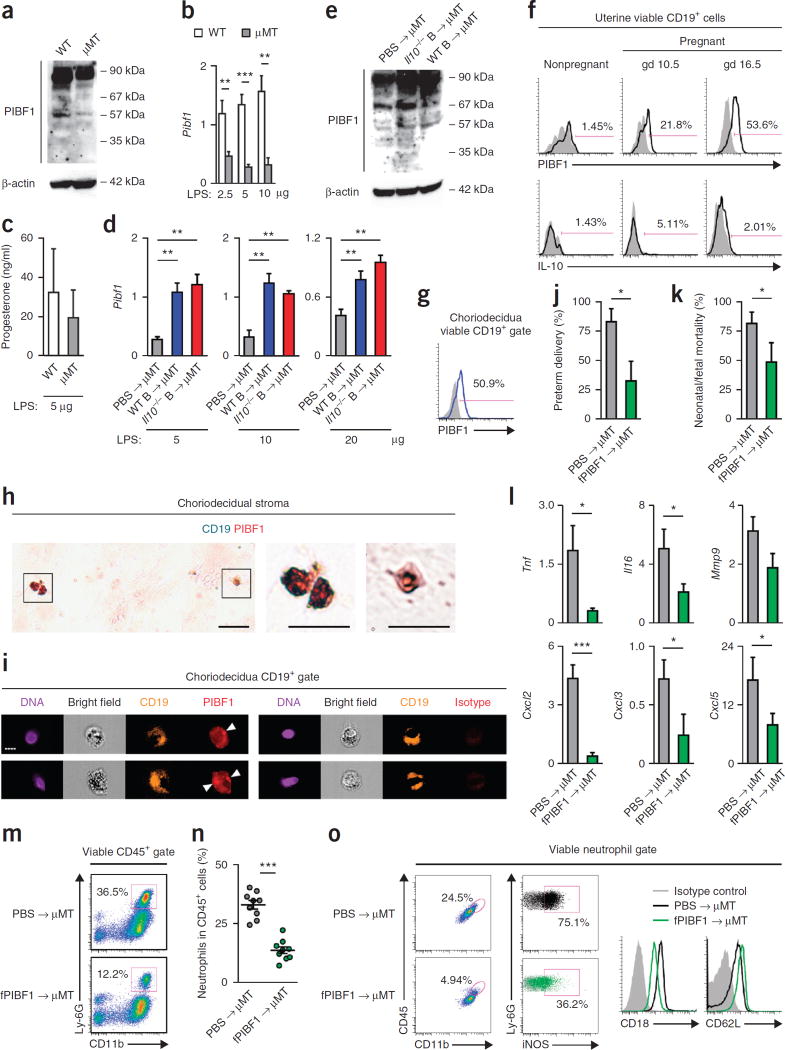
Figure 3.
B cells protect against PTL via PIBF1-dependent suppression of uterine inflammation. (a) Western blot analysis (n = 3) of PIBF1 in uterine tissues of WT or µMT mice on gd 16.5. (b) Fold change of Pibf1 transcript in uterine tissues of WT or µMT mice 24 h after receiving LPS given on gd 16.5, relative to the gene transcripts in uterine tissues of the respective mice that did not receive LPS. (c) ELISA of serum progesterone concentrations in WT and µMT mice 24 h after 5 µg LPS challenge. (d) Fold change of Pibf1 transcript in uterine tissues of gd 17.5 µMT mice after receiving either PBS or WT or Il10−/− B cells on gd 14.5 and 5 µg LPS on gd 16.5, relative to the gene transcripts in uterine tissues of the respective mice that did not receive LPS. (e) Western blot analysis (n = 3) of PIBF1 in uterine tissues of µMT mice on gd 16.5 that received WT or Il10−/− B cells on gd 14.5. (f) Flow cytometry analysis of Pibf1 and IL-10 expression by uterine CD19+ B cells in nonpregnant WT mice and pregnant WT mice on gd 10.5 or 16.5. (g) Flow cytometric analysis of PIBF1 expression by choriodecidual CD19+ B cells in a woman with TL. (h) Immunohistochemical analysis of TL choriodecidual stroma for CD19 (turquoise) and PIBF1 (red). Scale bars, 20 µm. (i) Imaging flow cytometry analysis of PIBF1 expression by TL choriodecidual CD19+ B cells. Arrowheads point to concentrated perinuclear PIBF1 staining. Scale bar, 7 µm. (j,k) Rates of preterm delivery and neonatal/fetal mortality on gd 17.5 of µMT mice that received either PBS or fPIBF1 and 5 µg LPS on gd 16.5. (l) Fold change of Tnf, Il6, Mmp9, Cxcl2, Cxcl3 and Cxcl5 transcripts in uterine tissues of µMT mice 24 h after PBS or fPIBF1 administration and 5 µg LPS, relative to the gene transcripts in uterine tissues of the mice that received PIBF1 but not LPS. (m,n) Frequency of CD11b+Ly-6G+ neutrophils in CD45+ cells in uterine tissues of gd 17.5 µMT mice after receiving either PBS or fPIBF1 and LPS on gd 16.5. (o) Expression of surface CD11b, CD18, CD62L and intracellular iNOS by viable neutrophils in uterine tissues of a µMT mouse 24 h after receiving PBS or fPIBF1 and LPS. Data represent the results from five (a–f) or nine mice (j–o) per group. *P < 0.05, **P < 0.01, ***P < 0.001, by Fisher’s exact test (j), one-tailed Mann–Whitney U test (k) or one-tailed t test (b,d,l,n).

