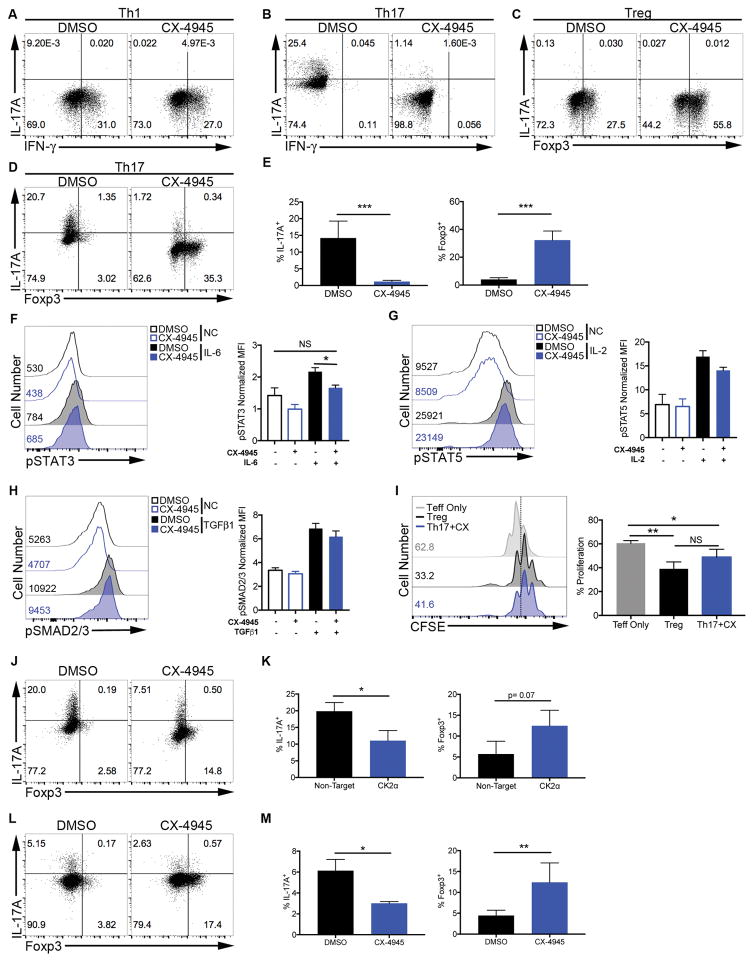
Figure 2. Inhibition of CK2 Selectively Suppresses Th17 Cell Differentiation and Promotes Tregs.
(A, B) T cells were cultured in (A) Th1 and (B) Th17 conditions in the absence or presence of CX-4945 (2 μM) and at 72 h stained for IFN-γ and IL-17A. (C, D) Cells were cultured in (C) Treg and (D) Th17 conditions in the absence or presence of CX-4945 and at 72 h stained for Foxp3 and IL-17A. Data are representative of at least 3 independent experiments. (E) Mean frequencies of IL-17A+ and Foxp3+ cells in Th17 conditions +/− SEM are shown (n=6). (F–I) T cells were activated for 24 h, cultured in serum free media +/− CX-4945 (2 μM) for 4 h, then stimulated with (F) IL-6 (10 ng/ml) for 2 h, (G) IL-2 (5 ng/ml) for 30 min, or (H) TGFβ1 (5 ng/ml) for 30 min, and stained for phosphorylated Y705 STAT3, Y694 STAT5 or S463/465 Smad2 and S465/467 Smad3, respectively. NC: no cytokine. Representative histograms and MFIs normalized to isotype controls +/− SEM are shown (n=3). (I) Il17fThy1.1.Foxp3GFP T cells were polarized to the Th17 phenotype in the presence of CX-4945 (Th17+CX) or the Treg phenotype. GFP+ cells were sorted and co-cultured with CFSE-labeled effector T cells and proliferation assessed by CFSE dilution after 72 h. Representative histograms and mean frequencies of cells undergoing 3 or more divisions +/− SEM are shown (n=3). (J, K) T cells were transfected with the indicated siRNAs and polarized in Th17 conditions for 72 h. (J) A representative FACS plot and (K) mean frequencies of IL-17A+ and Foxp3+ cells +/− SEM are shown (n=3). (L, M) PBMCs were isolated from human blood and cultured in Th17 conditions for 6 days. (L) A representative FACS plot and (M) mean frequencies of IL-17A+ and Foxp3+ cells +/− SEM are shown (n=3). *p<0.05, **p<0.01, ***p<0.001.

