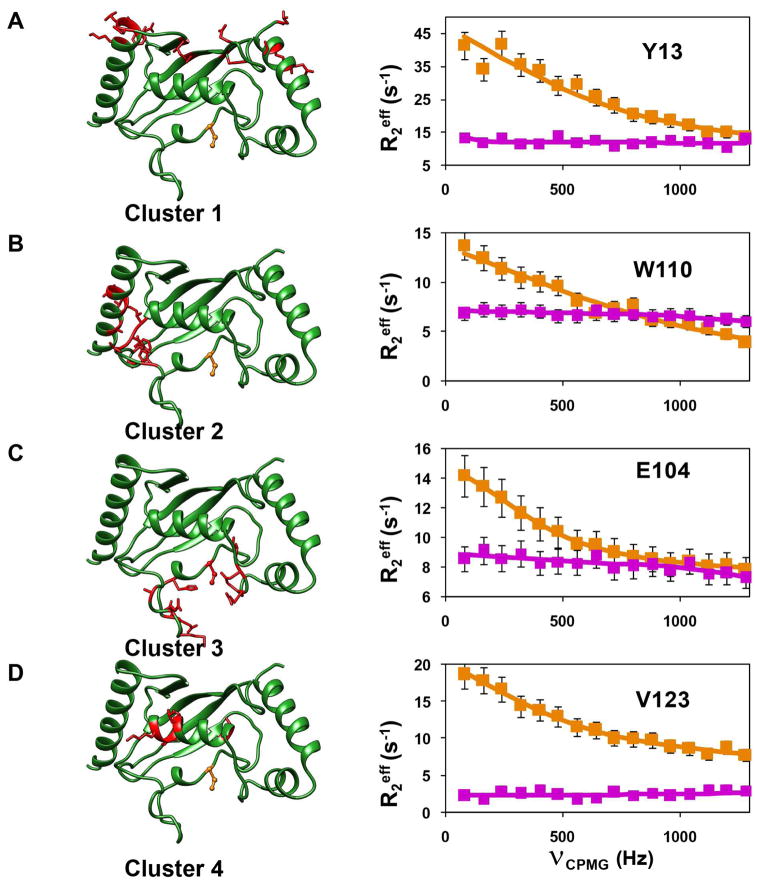
Figure 3. Observed μs-ms dynamics in Ube2g2.
Ube2g2 is shown in green ribbon representation on the left (active site C89 shown in orange, ball-and-stick representation). Residues experiencing motion at the same timescale are clustered and in red, stick representation. CPMG relaxation dispersion profiles (squares) and fits (solid line) for a representative residue in each cluster are shown on the right. (A) Y13 for cluster 1, (B) W110 for cluster 2, (C) E104 for cluster 3 and (D) V123 for cluster 4. Dispersion profiles represent both free Ube2g2 (orange) and Ube2g2 in Ube2g2:G2BR (magenta). See also Figures S1, S2, Supplemental Data Set 1 and Table S2.

