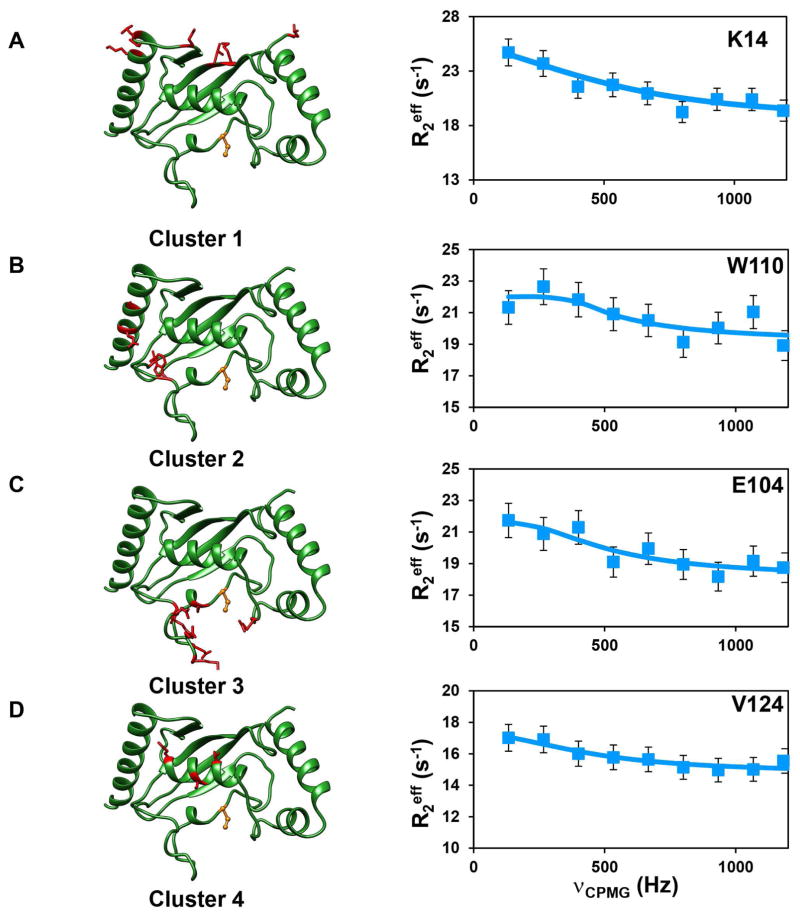
Figure 6. Observed μs-ms dynamics in Ube2g2 in the Ube2g2:RING-G2BR complex.
(A–D) The protein structure and residue coloring is as depicted in Figure 3. The relaxation dispersion profiles for representative residues in each cluster (cyan squares) and fit (solid line) of the data are given as in Figure 3. See also Supplemental Data Set 2 and Table S3.

