Fig. 6.
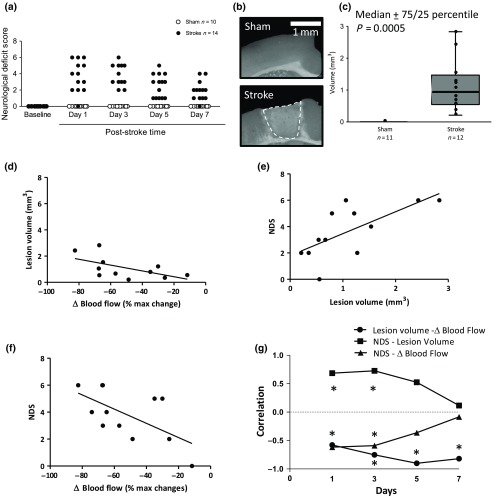
Neurological deficit score and histological quantification following ischemic stroke. (a) NDS assessed in sham (white symbols ) and stroke (black symbols ) mice. (b) Representative pictures showing ROIs (cortex) of coronal brain sections stained with FJC for ischemic cell death. Scale bar of 1 mm. (c) Quantitative analysis of infarct volume 7 days after sham () or stroke () surgery. Correlation at day 1 between: (d) lesion volume and changes in blood, (e) lesion volume and NDS, (f) changes in blood flow and NDS one day following stroke induction. (g) Time courses of correlation between lesion volume and changes in blood flow, NDS and lesion volume, and NDS and changes in blood flow. Results from NDSs were evaluated with the Scheirer–Ray–Hare extension of the Kruskal–Wallis test. Infarct volume between groups was evaluated using the Mann–Whitney test, and data are shown as percentile. Pearson’s correlation coefficient was used to assess correlations.

