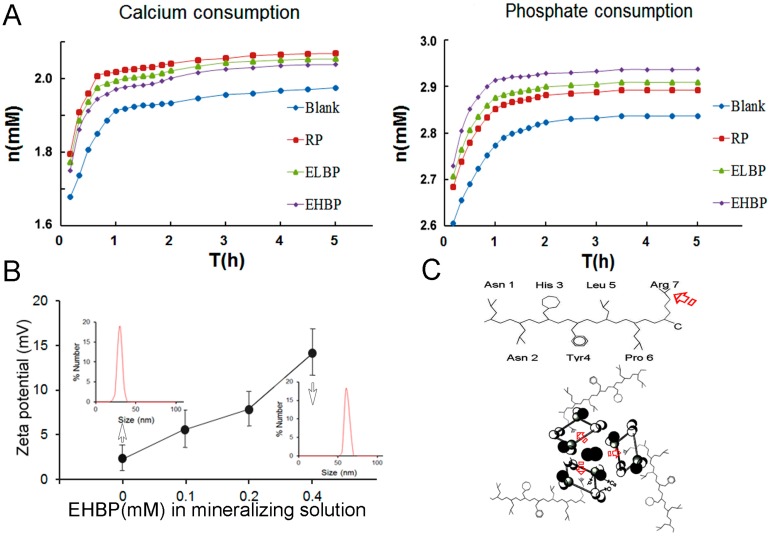
Figure 5.
Rate of calcium ((A) left) and phosphate ((A) right) consumption in the presence of: no peptide, 0.4 mM RP, 0.4 mM ELBP and 0.4 mM EHBP. Zeta potentials of solution particles after EHBP added at different concentrations from 0 to 0.4 mM (B) and the change of particle distributions without EHBP ((B), inset) and in presence of 0.4 mM EHBP ((B), inset). The amino group arrangement of EHBP ((C) upper) and the interaction between EHBP and calcium phosphate clusters was schematically illustrated, where the arrow indicates the possible binding sites of EHBP to the PO43− group ((C), lower).

