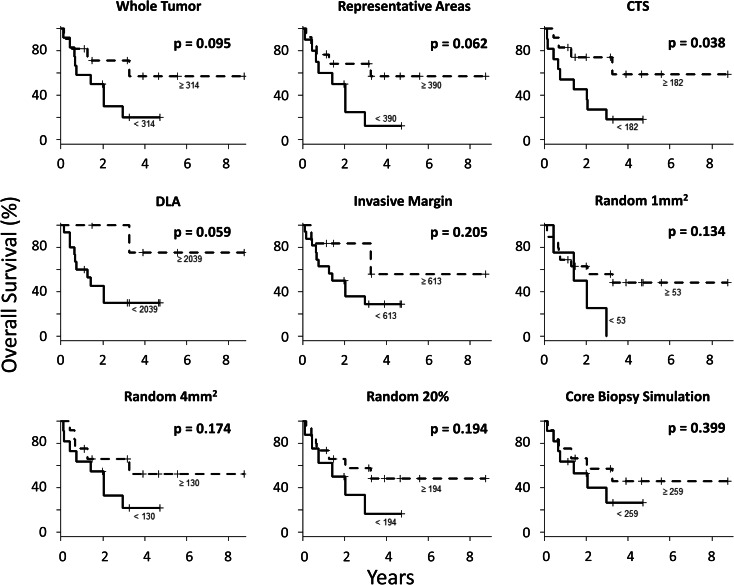
Fig. 5.
Association of CD8 densities with outcomes. Kaplan–Meier curves showing the overall survival of patients whose tumors have high versus low CD8 density as obtained by each of the different sampling strategies. Cutoff values for each strategy defined using the Contal and O’Quigley method [29] are noted. Log-rank tests are used to assess the significance of the difference between the OS of the high CD8 group and that of the low CD8 group. The distribution of patients into groups of high and low CD8 tumor infiltration according to each sampling strategy is as follows: 12 and 11 for the whole tumor densities, 10 and 13 representative areas, 11 and 12 central tumor sampling (CTS), 15 and 5 for dense lymphoid aggregates (DLAs), 16 and 6 invasive margin, 4 and 19 random1, 11 and 12 for random4, 8 and 15 random20 %, and 11 and 12 for core biopsy simulation

