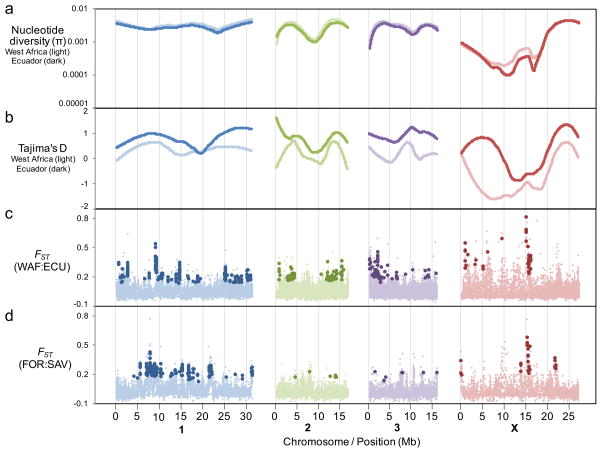
Figure 2.
Sequence variation in the nuclear genome of O. volvulus. (a) Local polynomial regression lines of best fit of π based on West Africa (light lines) and Ecuador (dark lines) samples (per 50kb window on each chromosome). (b) Local polynomial regression lines of best fit of Tajima’s D based on West Africa (light lines) and Ecuador (dark lines) samples (per 50kb window on each chromosome). (c and d) The average fixation index (FST) of sliding windows across the chromosomes was plotted to compare West African and Ecuadorian populations. The “outlier” windows with high inter-population variation are indicated with lager, darker markers (n=293 autosomal and n=40 X chromosomal regions for West Africa:Ecuador, and n=194 autosomal and n=28 X chromosomal regions for forest:savanna).

