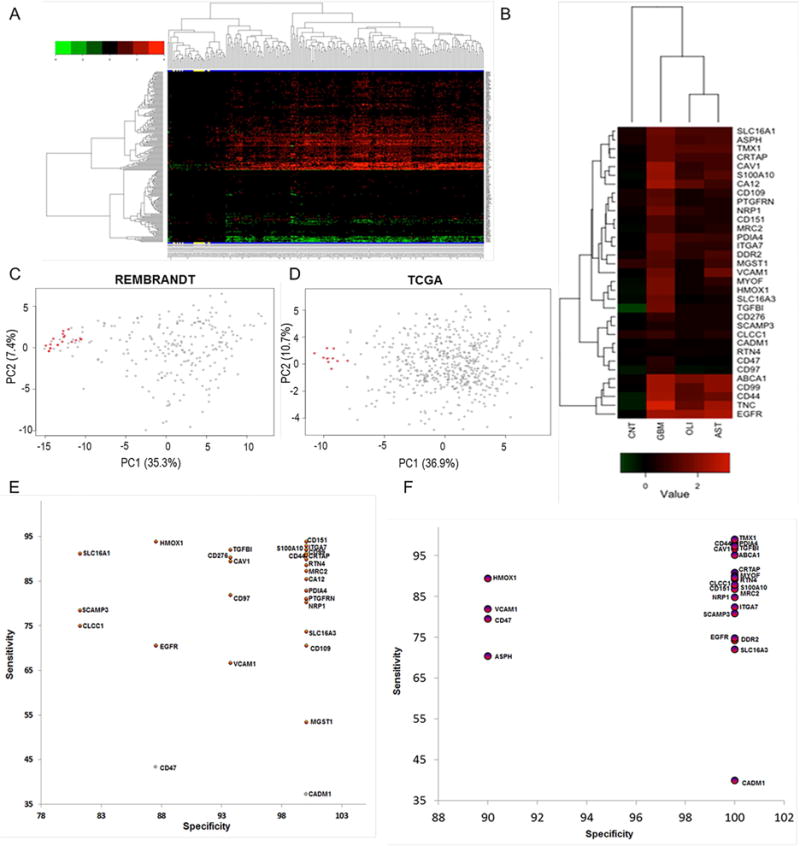
Figure 3.

Cell-surface proteins with transmembrane domains identified from shotgun proteomics were evaluated for their differential expressions using transcriptome compendiums of REMBRANDT and TCGA. A) The differential expression of 202 cell-surface transmembrane proteins in GBM tissues (N=228) relative to non-tumor brain specimens (N=16) of REMBRANDT transcriptome compendium. Expression values for these transcripts were log2 transformed, and a minimum of two-fold average expression change (FDR<0.05) between tumor and non-tumor brain tissues was used as cut-off for significance. Clustering reflects the directionality of cell-surface transmembrane transcript expression among GBM and controls. Non-tumor brain specimens are highlighted in yellow at the bottom. B) majority of the cell-surface proteins with transmembrane domains mapped to REMBRANDT transcripts were discarded due to common expressions in non-GBM diseases such as astrocytoma (N=148) and oligodendroma (N=67 tumors). Shown are 33 cell-surface transmembrane proteins that were subsequently tested for the development of GBMSig classifier. Each column of the heatmap is presented as the average log2 [tumor/non-tumor] ratios. CNT is non-tumor brain, AST is astrocytoma, and OLI is oligodendroma. C) Principal component analysis (PCA) of REMBRANDT GBM transcriptome arrays with GBMSig (n=33). Red dots represent non-tumor isolates and grey ones are GBM. Two principal components can explain 43% of the variability. D) Principal component analysis (PCA) of independent TCGA GBM transcriptome datasets composed of 547 GBM specimens and 10 non-tumor brain controls with GBMSig (n=33). Two principal components can explain 48% of the variability. Red dots represent non-tumor isolates and grey ones are GBM. E) ROC analysis of REMBRANDT tissue arrays for individual GBMSig proteins. Specificity (%) and Sensitivity (%) values of individual GBMSig were plotted on X and Y axis respectively. Standard error of AUC was calculated using the method described by DeLong et al. Orange color represents significance level P (Area=0.5) <0.0001 while gray color represents P>0.01.Detailed analysis is provided in table S2. F) ROC analysis of independent TCGA tissue arrays (GBM=547 subjects, NonTumor=10 subjects) for individual GBMSig proteins. Specificity (%) and Sensitivity (%) values of individual GBMSig were plotted on X and Y axis respectively. Standard error of AUC was calculated using the approach described by DeLong. The analysis revealed high degree of specificities and sensitivities in discriminating GBM populations from controls with significance level P (Area=0.5) <0.0001. Detailed analysis is provided in Table S2.
