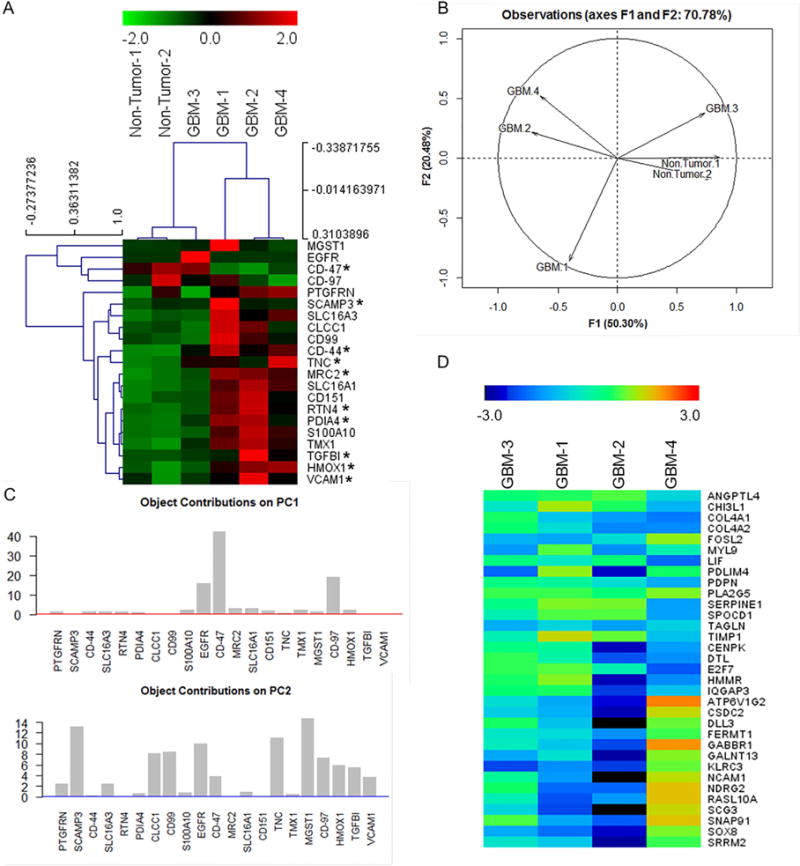
Figure 4. Proteomic verification of GBMSig expression in GBM tissues by SRM mass spectrometry.

A) Equal quantities of tissue homogenates from tumor (n=4) and non-tumor isolates (n=2) were enzymatically digested, C18 clarified, and spiked with surrogate peptides labeled C-terminally with 13C15N K/R for SRM analysis. Ratios of endogenous and surrogate peptides were centroided and presented as Z-score in the heatmap. A subset of GBMSig (*) was also observed to be circulated in the blood plasma. Co-expression of several GBMSig proteins with BIGH3 (TGFBI) - a known TGFβ-inducible protein might be indicative of the presence of additional TGF-β responsive elements operating within GBMSig. Based on GBMSig expressions, GBM and non-tumor tissues can be arranged into groups as revealed through Spemann rank clustering. B) PCA analyses of GBMSig proteins as quantified by SRM mass spectrometry can distinguish GBM from non-tumor brain specimens with first two components explaining 70.78% of variability, highlighting the robustness of GBMSig in separating GBM from controls with high efficiency at both transcriptome and proteome levels. C) Contributions of each GBMSig protein onto respective principal components. Expected average contributions on PC1 and PC2 are denoted by a red and blue line respectively. D) Subtyping of GBM 1–4 tissues were performed using qPCR for 33 genes as described (Phillips et al., 2006). Accordingly, GBM-1 is assigned as prolifimes, GBM-2 as mesenchymal, GBM-3 as proliferative, and GBM-4 as proneuronal. This subtyping allowed us to explain the heterogeneities in GBMSig expression observed from proteomic analysis. Subtype expression data (qPCR) are provided in table S5.
