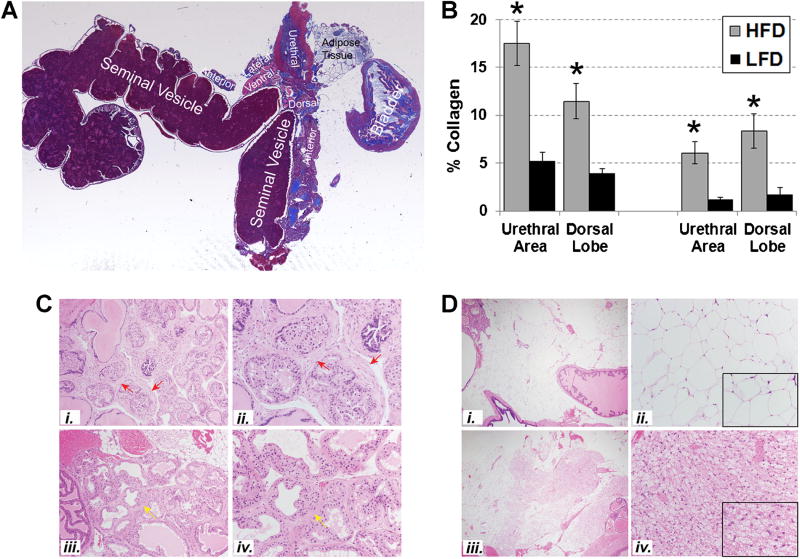
Fig. 5.
HFD-fed mice exhibit lower urinary tract fibrosis. A: Masson’s Trichrome stained tissue sections of fixed and embedded mouse lower urinary tracts were digitally imaged and color segmented using a subprogram within MATLAB that separates and quantifies color elements from images of Masson’s Trichrome stained tissues, permitting quantitation of blue-stained areas corresponding to extracellular collagen [16,23]. B: The percent collagen content of the prostatic dorsal lobes of SAMP6 (P < 0.001) and AKR/J (P < 0.01) HFD-fed mice demonstrated 2–4× higher collagen levels than those of LFD-fed mice (P < 0.001). Similarly, the urethral regions of SAMP6 (P < 0.001) and AKR/J (P < 0.001) HFD-fed mice (P < 0.003) demonstrated 2–4× higher collagen levels than those of LFD-fed mice. C: Photomicrographs (20×, i, iii; 40×, ii, iv) of serial hematoxylin/eosin stained sections to those analyzed for collagen content demonstrated peri-glandular prostatic fibrosis (red arrows) in SAMP6 HFD-fed mouse #68 (i, ii) and milder focal fibroplasia/stromal expansion (yellow arrows) in SAMP6 LFD-fed mouse #80 (iii, iv). These differences in peri-glandular fibrosis were more evident in SAMP6 HFD-fed than LFD-fed mice but did not reach, statistical significance (P = 0.10). D: Photomicrographs (4×, i, iii; 20×, ii, iv) of SAMP6 LFD-fed mice (i, ii) mice demonstrate significantly higher levels of brown adipose tissue (BAT) than white adipose tissue (WAT) compared to HFD-fed mice (iii, iv) (P = 0.005). Insets in ii and iv are at 40×. Tissues are shown from SAMP6 LFD-fed mouse #68 and HFD-fed mouse #80.

