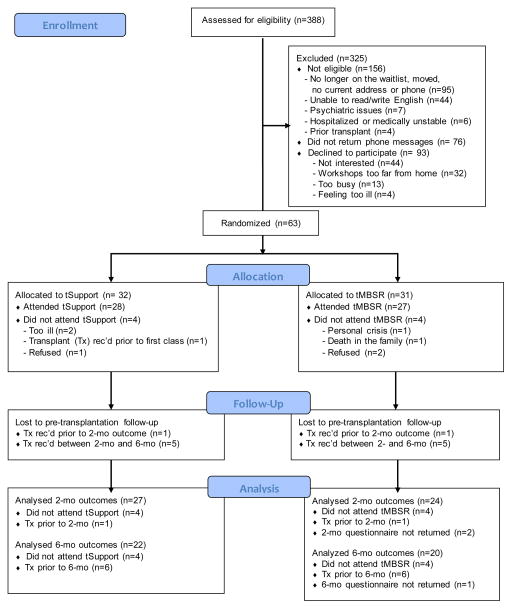
Figure 1. CONSORT Flow Diagram.
Participant flow diagram The flow of patients into the trial from initial contact through follow-up is detailed by treatment group. Of 63 patients randomized, 8 patients withdrew prior to attending their assigned intervention. The remaining patients (n=55) comprised the analysis sample, and of these, 51 had 2-month pre-transplant outcomes, and 42 had 6-month pre-transplant outcomes.

