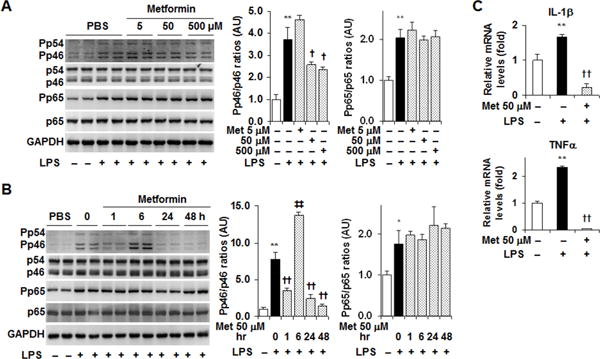
Figure 1. Metformin suppresses adipocyte proinflammatory responses.

After differentiation, 3T3-L1 adipocytes were used to examine the effects of metformin on the proinflammatory responses. (A) Dose-response study. Adipocytes were treated with metformin (Met) at a dose of 5, 50, or 500 μM (dissolved in phosphate-buffered saline, PBS) or PBS for 24 hr. (B) Time-course study. Adipocytes were treated with metformin (50 μM) for 0, 1, 6, 24, or 48 hr. (C) Adipocyte cytokine expression. Adipocytes were treated with metformin (50 μM) for 24hr. For A – C, prior to harvest, the cells were also treated with lipopolysaccharide (LPS, 100 ng/ml) for 30 min to analyze inflammatory signaling or LPS (20 ng/ml) for 6 hr to analyze cytokine expression. For A and B, adipocyte lysates were subjected to Western blot analysis. Blots were quantified using densitometry. AU, arbitrary unit. For C, cytokine expression was examined using real-time PCR. For bar graphs (A – C), data are means ± S.E. n = 4. *, P < 0.05 and **, P < 0.01 LPS in the presence or absence of Met vs. PBS (empty bar); †, P < 0.05 and ††, P < 0.01 Met at 50 or 500 μM in the presence of LPS vs. LPS alone; ‡‡, P < 0.01 Met treatment for 6 hr vs. LPS alone (in B, left bar graph).
