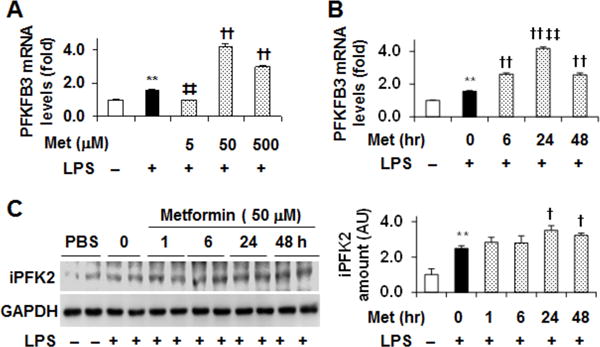
Figure 3. Metformin increases adipocyte expression of PFKFB3/iPFK2.

Adipocytes were differentiated and treated as described in Fig. 1. (A) PFKFB3 expression in the dose-response study. (B) PFKFB3 expression in the time-course study. For A and B, the mRNA levels of PFKFB3 were quantified using real-time PCR. (C) The amount of iPFK2 in time-course study was examined using Western blot analysis. Blots were quantified using densitometry. AU, arbitrary unit. Left panel, representative blots; right panel, quantification of blots. For bar graphs (A – C), data are means ± S.E. n = 4. **, P < 0.01 LPS alone vs. PBS (empty bar); ‡‡, P < 0.01 Met at 5 μM in the presence of LPS vs. LPS alone (in A) or Met for 24 hr vs. Met for any time period other than 24 hr (in B); †, P < 0.05 and ††, P < 0.01 Met at 50 or 500 μM in the presence of LPS vs. LPS alone (in A – C).
