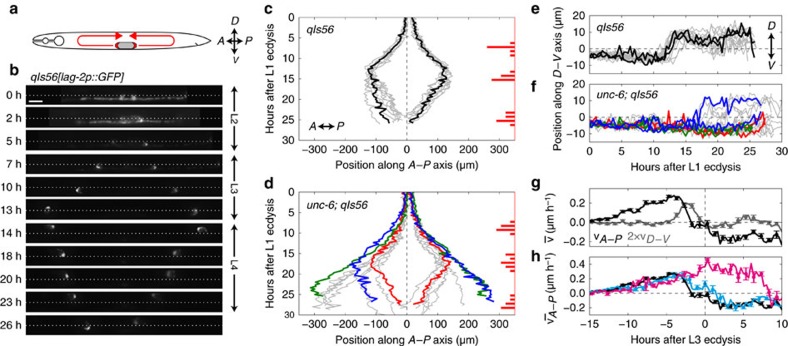
Figure 3. DTC migration.
(a) Overview showing the gonad (grey) and the DTC (red) migration path. (b) Computationally straightened microscopy images of a single animal carrying the qIs56[lag-2p::GFP] DTC body marker at different times after the L1 ecdysis. Dotted line indicates the central body axis. Orientation of A–P and D–V axes is as in a. Scale bar, 20 μm. (c) A–P position as function of time in qIs56 animals (N=10). Dashed line corresponds to the midbody. DTC trajectories for the animal in b are shown in black. Red bars show the fraction of animals in ecdysis as a function of time. (d) Same as c but for unc-6(ev400);qIs56 mutants (N=9). Coloured lines indicate animals in which DTCs moved inwards ventrally (red), DTCs failed to turn inwards (green) or a single DTC migrated dorsally (blue). (e) D–V position as a function of time. Dashed line corresponds to the central body axis. Trajectories for the animal in b are shown in black. (f) Same as e, but for unc-6;qIs56 mutants. Coloured lines correspond to the animals highlighted in d. (g) Average migration velocity  in wild-type animals as a function of time after L3 ecdysis. vA–P>0 indicates outward movement and vA–P<0 inward movement. Error bars are s.e.m. (h) Average A–P velocity for DTCs in wild-type animals (black), DTCs in unc-6;qIs56 mutants that moved inwards after the L3 ecdysis (cyan) and anterior DTCs in unc-6;qIs56 mutants that only moved outwards (magenta).

