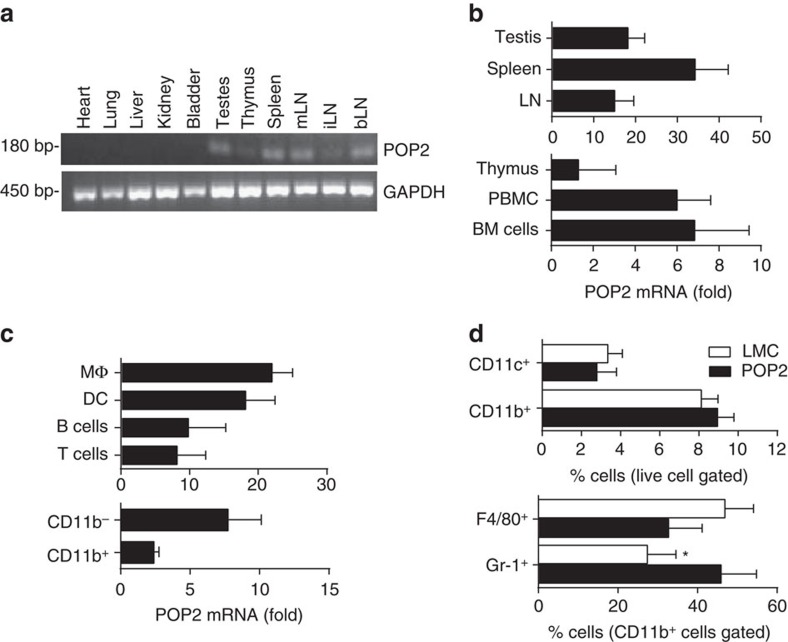
Figure 1. Expression of POP2 in transgenic mice.
(a) Detection of POP2 Tg expression by RT–PCR in perfused organs (Supplementary Fig. 3). (b,c) Relative POP2 Tg basal mRNA levels (normalized to GAPDH) in various tissue and cellular compartments by qPCR. The data are shown as mean fold change relative to LMC±s.d. (n=4). (d) The frequency (%) of major myeloid-lineage cells (CD11c+ dendritic cells, CD11b+ myeloid cells, F4/80+ macrophages (CD11b+CD11c−Gr-1−F4/80+) and Gr-1+ neutrophils (CD11b+CD11c−Gr-1+F4/80−)) in spleen. The data are shown as mean±s.d. (n=4). To determine significance, Student’s t-test was performed. *P<0.05. LN, lymph nodes; mLN, mesenteric LN; iLN, inguinal LN; bLN, brachial LN; BM, bone marrow.

