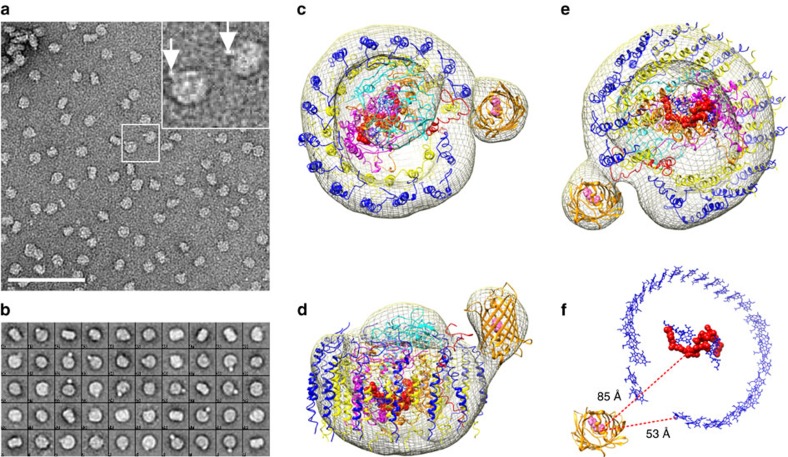
Figure 3. Electron microscopy and 3D reconstruction of the RC/YFP–LH1 complex.
(a) Electron micrograph of purified, negatively stained RC/YFP–LH1 complexes; the two complexes in the central white box are enlarged in the inset, with white arrows indicating the density arising from YFP. Scale bar, 100 nm. (b) Gallery of 40 selected 2D averaged classes; the box size is 28 × 28 nm. Overall, 11,777 particles were used for reconstruction of the 3D model. (c–f) The reconstructed model of the RC/YFP–LH1 complex at 29 Å resolution; the diagram shows the electron density (grey mesh), and the following subunits: LH1β (blue), LH1α (yellow), PufX (red), RC-M (magenta), RC-H (cyan) and RC-L (orange). YFP is in gold. The RC special pair of BChls is shown in red. The structural model is viewed from (c) the cytoplasmic side of the membrane, (d) the plane of the membrane, (e) the periplasmic side, (f) the periplasmic side of the complex, showing only YFP and the LH1 and RC pigments. The dashed red lines show the distances between the YFP chromophore, the RC special pair BChls (red) and LH1 BChls (blue).

