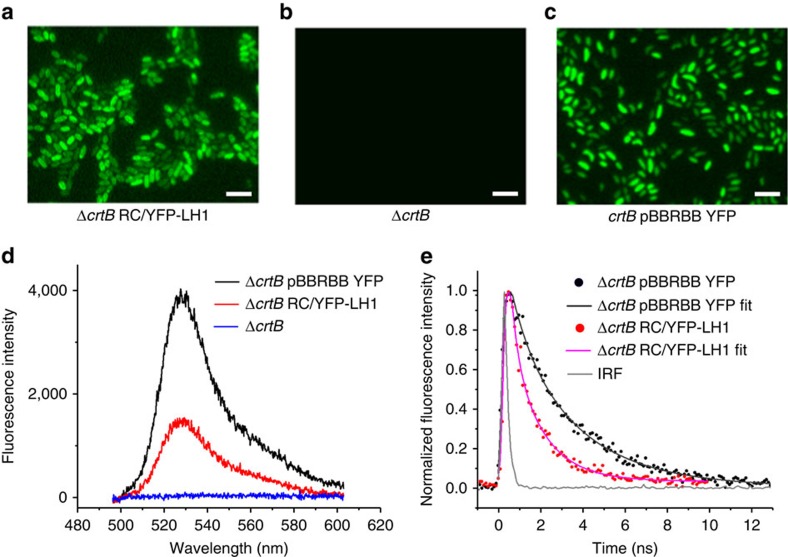
Figure 4. Spectral and lifetime imaging of YFP in ΔcrtB RC/YFP–LH1 and ΔcrtB pBBRBB–YFP whole cells.
(a–c) Fluorescence images of whole cells of ΔcrtB RC/YFP–LH1, ΔcrtB and ΔcrtB pBBRBB–YFP cells when excited at 495 nm. (d) Fluorescence emission spectra, each recorded on a single cell. (e) Fluorescence lifetime decay curves recorded at a central wavelength of 550 nm. The best fits, displayed as blue and red lines, were achieved using a double-exponential decay function. The measured instrument response function (IRF) of the system was ∼0.18 ns and taken into account during fitting. Scale bars, 5 μM.

