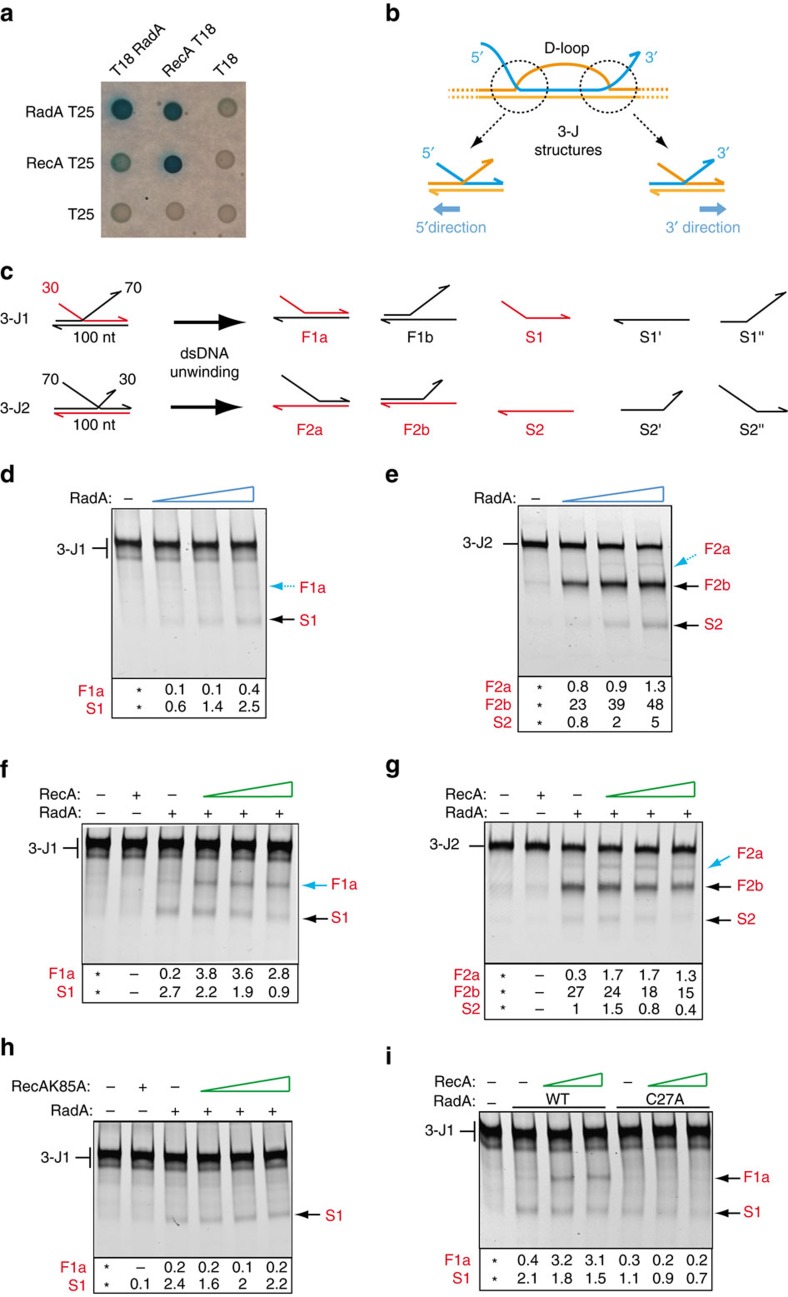
Figure 5. Interplay between RadA and RecA.
(a) RadA and RecA self- and cross-interact with each other in bacterial two-hybrid assay. See also Supplementary Fig. 6. (b) Schematic representation of the HR D-loop highlighting the two 3-J structures that define its boundaries. 5′ and 3′ dsDNA unwinding directions of the recipient dsDNA are given according to the 5′ to 3′ polarity of the invading ssDNA (depicted in blue), respectively. (c) Synthetic 3-J1 and 3-J2 substrates used to analyse RadA helicase activity, and the products that could result from their unwinding. Products detected by fluorescence are depicted and labelled in red (F, forked DNA; S, ssDNA). See also Supplementary Figs 6 and 8. (d,e) Helicase assays performed on 3-J1 and 3-J2, respectively, with increasing amounts of RadA (80, 250 and 750 nM). Black and blue arrows indicate major and minor products, respectively. (f,g) Helicase assays performed on 3-J1 and 3-J2, respectively, with RadA (750 nM) in the presence of increasing amounts of pneumococcal RecA (300, 600 and 900 nM). Bold blue arrows indicate increases in products obtained at low level in experiments performed with RadA alone (in d–e). (h) Helicase assays on 3-J1 performed with RadA (750 nM) in the presence of the RecAK85A ATPase mutant (150, 300 and 600 nM). (i) Comparison of unwinding activities of RadA and RadAC27A (750 nM) on 3-J1 in the presence of RecA (300, 600 nM). See Supplementary Fig. 6. In panels d to i, values of the relative amounts of DNA products (% of total DNA) in each assay are reported below the images of the gels; the * indicates the assay without protein, from which the amount of unwound substrate has been quantified and retracted from the assays performed in the presence of protein (as detailed in Methods).

