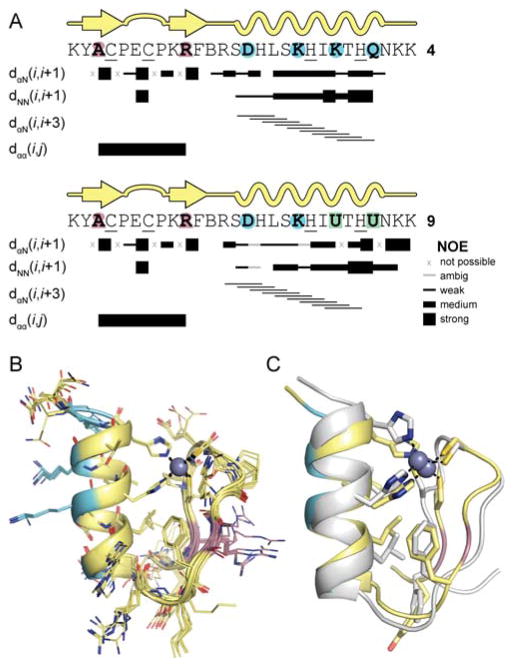
Figure 9.
Analysis of the folded structure of 4 and 9 by NMR. (A) Secondary structure maps with select short- and medium-range NOE correlations supporting that assignment. (B) Overlay of the 9 lowest energy structures of peptide 4 as determined by simulated annealing with NOE distance restraints. Color code for carbons matches that in Figure 2. (C) Overlay of the NMR structure of peptide 4 (color) with that of Sp1–3 (white).

