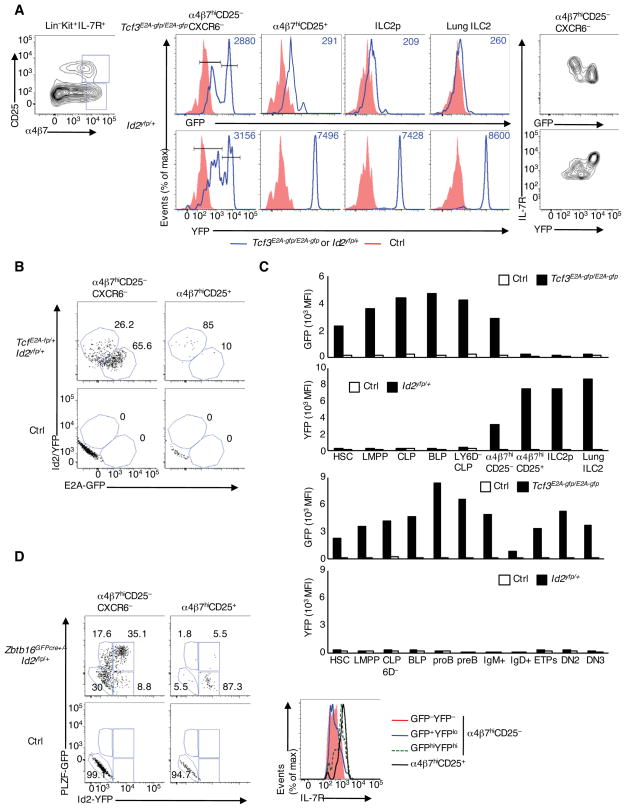
Figure 1. The Developmental Progression of Innate Lymphoid Cells Defined by inversely Correlated E2A and Id2 Abundance.
(A) Flow cytometric analysis of α4β7 and CD25 expression gated on Lin−Kit+IL-7R+ derived from the bone marrow (BM) (left). GFP and YFP expression in α4β7hiCD25−CXCR6−, α4β7hiCD25+, ILC2p in the BM and ILC2 in the lung of control (red), Id2yfp/+ or Tcf3E2A-gfp/E2A-gfp mice (blue). IL-7R versus GFP or YFP expression was gated on α4β7hiCD25−CXCR6− population (right). Numbers in plots (middle) indicate mean fluorescence intensity of GFP and YFP (MFI) (representative data from two independent experiments). (B) GFP and YFP expression gated on α4β7hiCD25−CXCR6− and α4β7hiCD25+ cells. Numbers adjacent to outlined areas indicate the GFPhiYFPlo or GFPloYFPhi population (representative from two independent experiments) (C) GFP or YFP expression at various stages of development from HSC to ILC2 in the lung and to DN3 thymocytes derived from control (blank), Id2yfp/+ or Tcf3E2A-gfp/E2A-gfp mice (black), presented as MFI (representative from two independent experiments) (D) GFP and YFP expression from Zbtb16GFPcre+/−Id2yfp/+ and control mice. Expression of IL-7R in GFP−YFP−, GFP+YFPlo, and GFPhiYFPhi of α4β7hiCD25−CXCR6− cells and in α4β7hiCD25+ cells (right) (representative from two independent experiments) Definitions of cell populations were shown in Experimental procedures. See also Figure S1.

