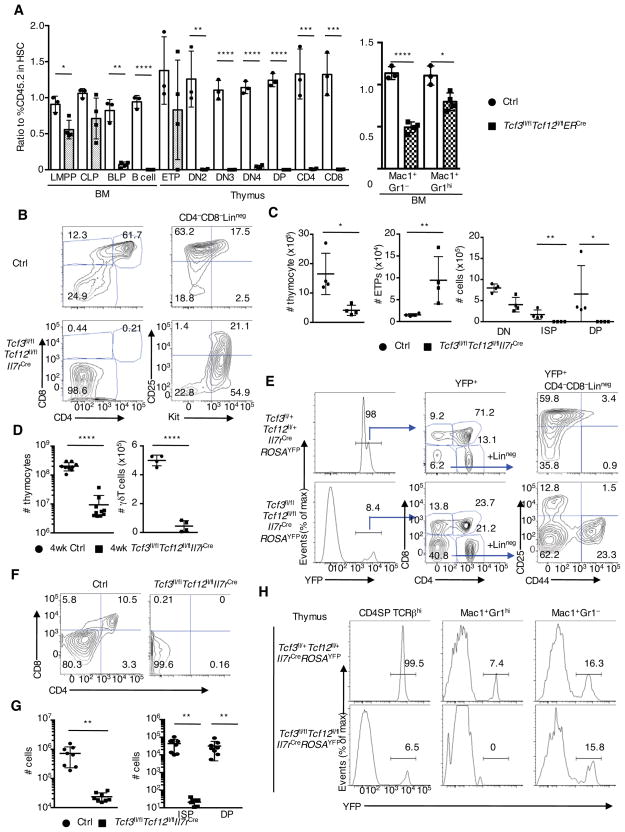
Figure 2. Thymocyte Development in Tcf3fl/flTcf12fl/flIl7rCre Mice is Severely Impaired.
(A) The ratio of %CD45.2 to that in HSC. Each dot represents the ratio of % CD45.2 (ratio in HSC defined as 1.0) from a single recipient mouse. Strategy for competitive BM transplantation and flow cytometric analysis of CD45.1 and CD45.2 expressions are shown in Figure S2B and S2C (n=3–4, two independent experiments) (B) Flow cytometric analysis of CD4 versus CD8 expression in total fetal thymocytes, and Kit versus CD25 gated on CD4−CD8−Lin− cells derived from 17.5 dpc control and Tcf3fl/flTcf12fl/flIl7rCre mice. Numbers in gates and quadrants indicate percentage of cells in each compartment. (C) Cell numbers of total thymocytes, ETPs (CD4−CD8−Lin−KithiCD25−), DN, ISP and DP cells derived from 17.5 dpc control and Tcf3fl/flTcf12fl/flIl7rCre fetal thymi (n=4, two independent experiments). (D) Cell numbers of total thymocytes and γδT cells (CD3ε+TCRγδ+) isolated from 4-week-old littermate control and Tcf3fl/flTcf12fl/flIl7rCre mice (n=9, 6 independent experiments). (E) Flow cytometric analysis of YFP expression in total thymocytes (left), CD4 and CD8 expression gated on YFP-expressing thymocytes (middle), and CD44 and CD25 expression gated on YFP+CD4−CD8−Lin− cells (right) (representative from two independent experiments). (F), (G) Sorted ETPs (CD44+CD25−Kithi) from 15.5 dpc littermate control or Tcf3fl/flTcf12fl/flIl7rCre fetus were co-cultured with Tst-4-DL1 stroma cells (300 cells/well). Representative flow cytometric analysis of CD4 and CD8 expression gated on CD45+Thy1.2+ cells after 12 days in culture is shown. Cell numbers of reconstituted cells, and ISP and DP cells, and their percentages on day 12 are indicated. Two independent experiments produced with similar results (n=8). (H) YFP-expression gated on CD4SP (CD4+CD8−TCRβhi), Mac1+Gr1hi, and Mac1+Gr1lo/− cells in thymi derived from 6–8-week-old Tcf3fl/+Tcf12fl/+Il7rCre (top) and Tcf3fl/flTcf12fl/flIl7rCre mice (bottom), as seen in Figure 2E. Numbers in plots indicate YFP-expressing cells. Data represent the mean ± SD. *, P < 0.05, **, P <0.01, ***, P <0.001, ****, P <0.0001 (Student’s t test). See also Figure S2.

