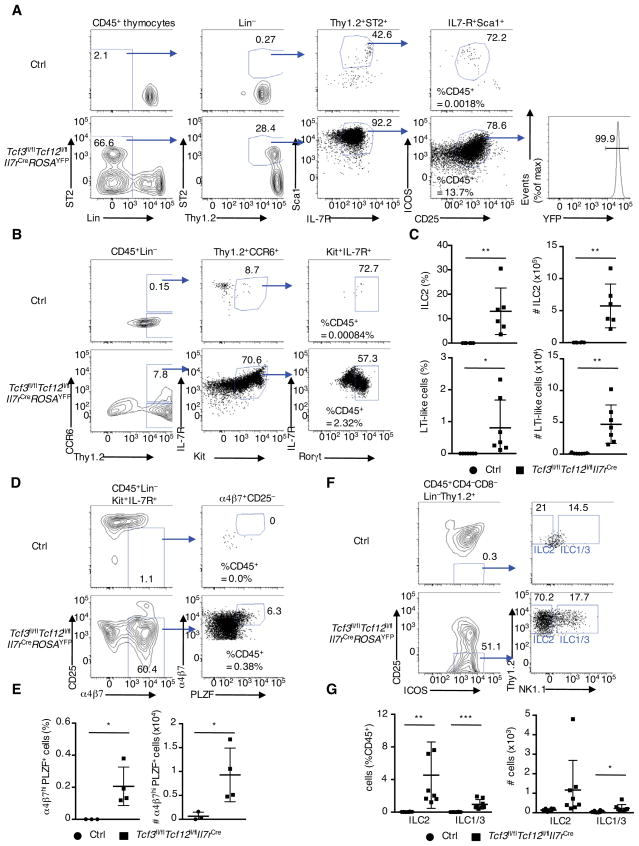
Figure 3. E2A and HEB Suppress the Development of Thymic ILC precursor, ILC2 and LTi-like Cells.
(A) Gating strategy for thymic ILC2 cells in 4-week-old littermate control and Tcf3fl/flTcf12fl/flIl7rCre mice, and YFP expression gated on ILC2s. Numbers in plots indicate percentages of cells in outlined areas. Proportions of ILC2s of CD45+ cells are shown in plot (left). (B) Gating strategy for thymic LTi-like cells in 4-week-old Tcf3fl/flTcf12fl/flIl7rCre mice. For LTi-like cell staining, we excluded CD4 as a lineage marker. (C) Frequency and cell numbers of ILC2 and LTi-like cells in thymi derived from 4-week-old littermate control and Tcf3fl/flTcf12fl/flIl7rCre mice (n=6, cumulative from 5 independent experiments). (D) Flow cytometric analysis of ILC precursor cells. Proportions of ILC precursor gated on CD45+ cells are shown in plot. (E) Frequency and cell number of ILC precursors in thymi derived from 4-week-old littermate control and Tcf3fl/flTcf12fl/flIl7rCre mice. (n=3–4, cumulative from 3 independent experiments). (F), (G) In vitro co-culture of ETPs derived from fetal thymi on Tst-4-DL1 stromal cells, as seen in Figure 2F and 2G. Flow cytometric analysis of ICOS and CD25 expression (left), and NK1.1 and Thy1.2 expression (right). Two independent experiments produced similar results. Frequency and cell number of ILC2 and ILC1/3 in reconstituted cells in vitro (n=8 per independent experiments). Data represent the mean ± SD. *, P < 0.05, **, P <0.01, ***, P <0.001 (Student’s t test).

