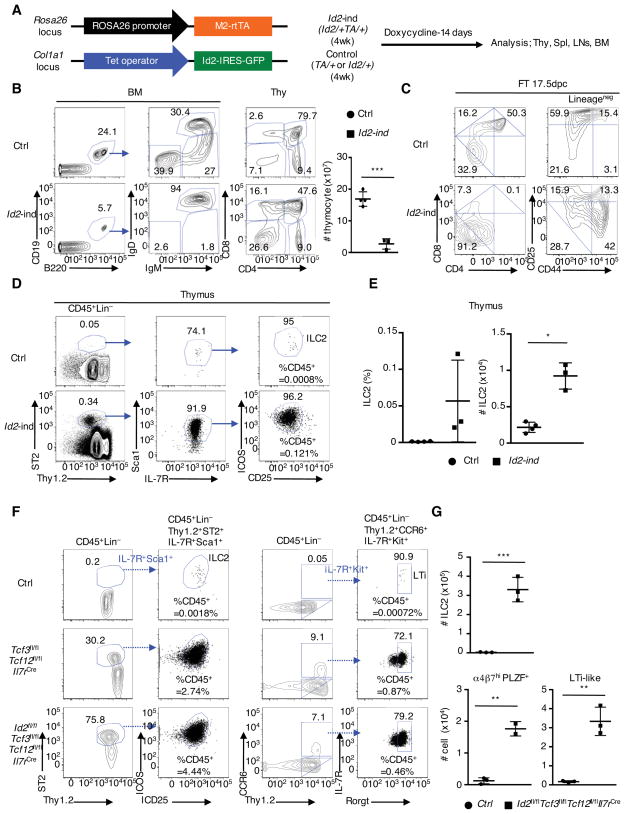
Figure 5. Inducible Id2-expression Blocks Adaptive Lymphoid Lineage Development but Activates Abnormal ILC2 Development.
(A) Schematic construction of Trans Activator (TA) in Rosa 26 locus and inducible Id2 in Col1a1 gene locus (left). 4-week-old Id2-inducible (Id2/+TA/+) and littermate control (TA/+, or Id2/+) mice were treated by feeding doxycycline-containing water and by intraperitoneal doxycyclin-injection (day0, 5, 10). Mice were analyzed 14 days post injection (right). (B) Flow cytometric analyses of CD19 and B220 expression (left), IgM and IgD expression (middle left) gated on CD19+B220+ B cell in the BM, and CD4 and CD8 expression in thymi (middle right), derived from Id2-inducible (Id2-ind) and littermate control (Ctrl) mice. Thymocyte numbers are shown (right). Data are representative from three independent experiments (n=3, one experiment). (C) Representative flow cytometric analysis of CD4 and CD8 expression (left), and CD44 and CD25 expression gated on lineage-negative thymocytes, derived from 17.5 dpc control and Id2-ind fetus, treated with doxycyclin for 4 days (representative from three fetal thymi). (D) Gating strategy for thymic ILC2s. Numbers in plot indicate percentages of ILC2s in the CD45+ thymocyte population. (E) Frequencies and cell numbers of ILC2s in thymi isolated from doxycyclin-treated Id2-inducible and control mice (n=3–4, one experiment). (F) Flow cytometric analyses of Thy1.2 and ST2 expression, CD25 and ICOS expression, Thy1.2 and CCR6 expression, and Rorγt and IL-7R expression, derived from 4-week-old control, Tcf3fl/flTcf12fl/flIl7rCre, and Tcf3fl/flTcf12fl/flId2fl/flIl7rCre mice. Percentages of ILC2s and LTi-like cells in the CD45+ population are shown. (G) Cell numbers of ILC2, LTi-like cells, and α4β7hiPLZF+ cells in thymi derived from 4-week-old littermate control and Tcf3fl/flTcf12fl/flId2fl/flIl7rCre mice are shown (n=3, cumulative from three independent experiments). Data represent the mean ± SD. *, P < 0.05, ***, P <0.001 (Student’s t test). See also Figure S4.

