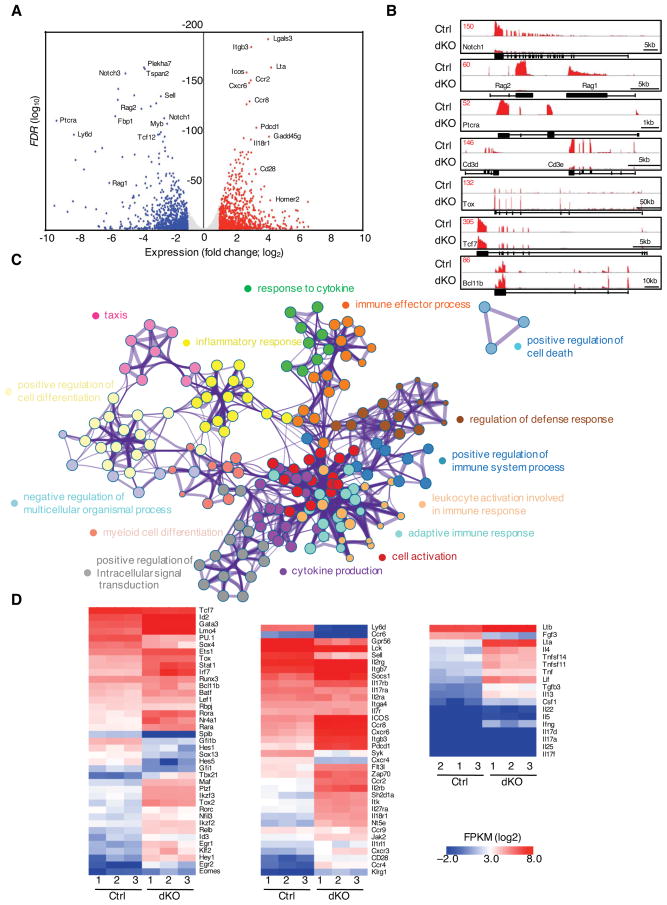
Figure 6. Combined Activities of E2A and HEB Activate a T-lineage Specific Program of Gene Expression in Early T cell Progenitors.
(A) Volcano plots representing RNA-seq reads in sorted ETPs (CD4−CD8−Lin−CD44+CD25−Kit+YFP+) derived from Tcf3fl/flTcf12fl/flIl7rCre fetal thymi. Points represent genes upregulated in Tcf3fl/flTcf12fl/flIl7rCre ETPs > twofold (red; FDR < 0.05 (calculated using raw count values)), genes downregulated in Tcf3fl/flTcf12fl/flIl7rCre ETPs > twofold (blue; P < 0.05) and not significantly changed (grey) as compared to control cells. Selected genes are labelled. (n=3) (B) Expression levels associated with the Notch1, Rag1/Rag2, Ptcra, Cd3d/Cd3e, Tox, Tcf7, and Bcl11b loci, presented as RNA-seq Reads Per Million reads aligned (RPM). (C) Gene Ontology (GO) analysis of significantly elevated gene expression levels in ETPs derived from Tcf3fl/flTcf12fl/flIl7rCre mice using Metascape. Top 15 clusters of GO terms are shown. (D) Heat maps of selected genes are presented to visualize differences in gene expression patterns for control and Tcf3/Tcf12-deficient ETPs isolated from fetal thymi. The heat maps represent different ontology groups, including genes encoding for factors that regulate transcription (left), cytokine/chemokine/surface receptors, signal transduction (middle) as well as cytokines (right). See also Figure S5 and S6.

