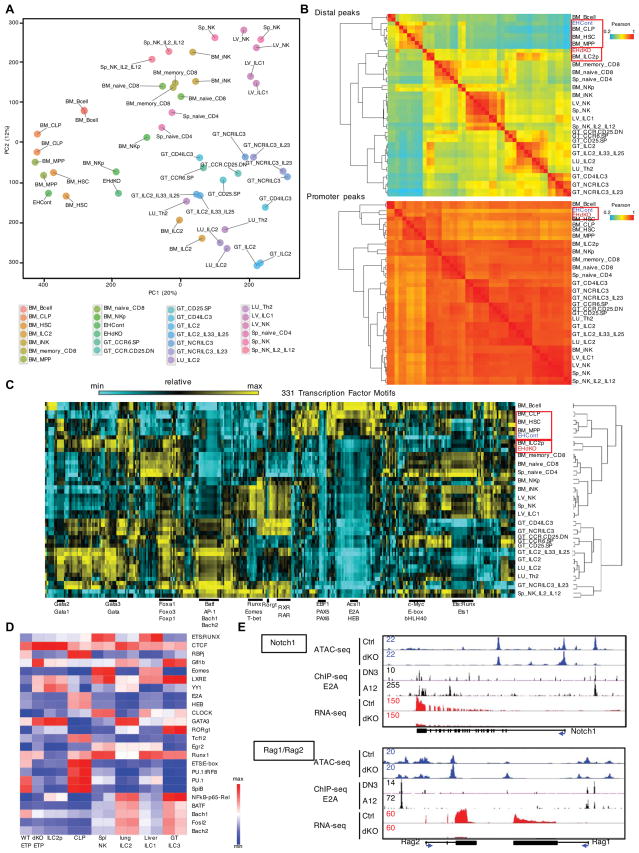
Figure 7. E2A and HEB Depleted Early T Cell Progenitors display Altered Chromatin Landscapes.
(A) Principal component analysis (PCA) was performed to cluster accessible chromatin (log2-transformed ATAC-seq signals) in different immune cell types as indicated. (B) Heatmap showing correlation of ATAC-seq reads in distal peaks (top) and promoter peaks (bottom) for indicated cell types including wild-type ETPs (EHCont) and Tcf3−/−Tcf12−/− ETPs (EHdKO). (C) Heatmap showing enrichment of 331 normalized transcription factor binding motifs (log2-transformed) in open chromatin regions for different immune cell types that exclude promoter regions (±2.5kbp of TSS). (D) Heatmap showing relative enrichment of transcription factor binding motifs for indicated cell types. (E) Browser shots of normalized ATAC, E2A ChIP-seq and RNA-seq reads across the Notch1 and Rag gene loci in control ETPs as well as ETPs depleted for E2A and HEB expression. ChIP-seq: E2A, DN3; Rag2−/− thymocytes, A12; E2A−/− E47-reconstituted T cell line. See also Figure S7.

