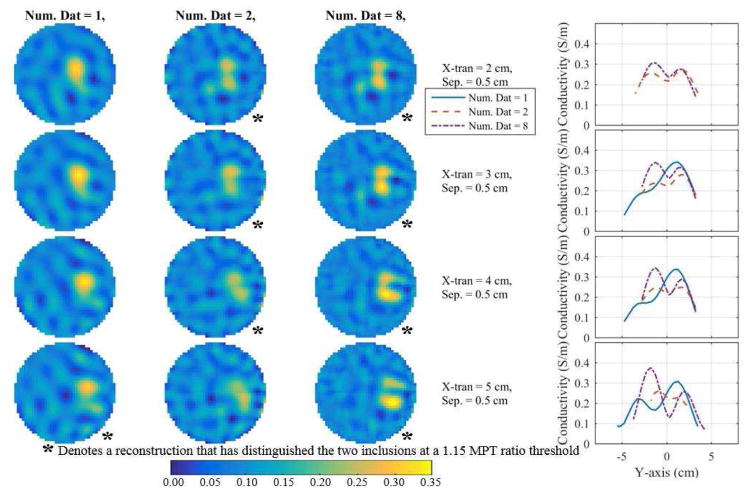
Fig. 7.
Reconstructions (using the DF/I and rotated-mesh approach) corresponding to the smallest distinguishable separation (across number of fused datasets) at each x-translation for 1, 2, and 8 fused datasets (first three columns) along with profiles through their respective peaks (last column). The profiles are the reconstructed conductivities over the line connecting the two peaks. If there is no profile for a number of fused datasets then two peaks were not detected.

