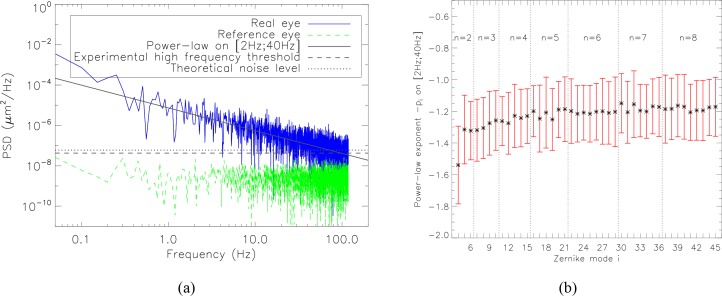
Fig. 7.
Power-law model of the temporal PSD of the aberration time series. (a) PSD of vertical coma (a7) measured on a real eye, in blue. The solid line indicates the power-law regression f−pi. The dotted straight line indicates the theoretical noise level (see Sect. 4.1 for details). The dashed straight line indicates the experimental high-frequency plateau of the temporal spectrum. For information, the level of local turbulence in the optical bench is given in green (corresponding to an acquisition at high flux on an artificial eye).(b) Distribution of the power-law exponent for each Zernike mode i up to the 8th order over the population for a 5-mm diameter pupil. Symbols indicate mean values of −pi and error bars plus and minus one standard deviation from the mean values.

