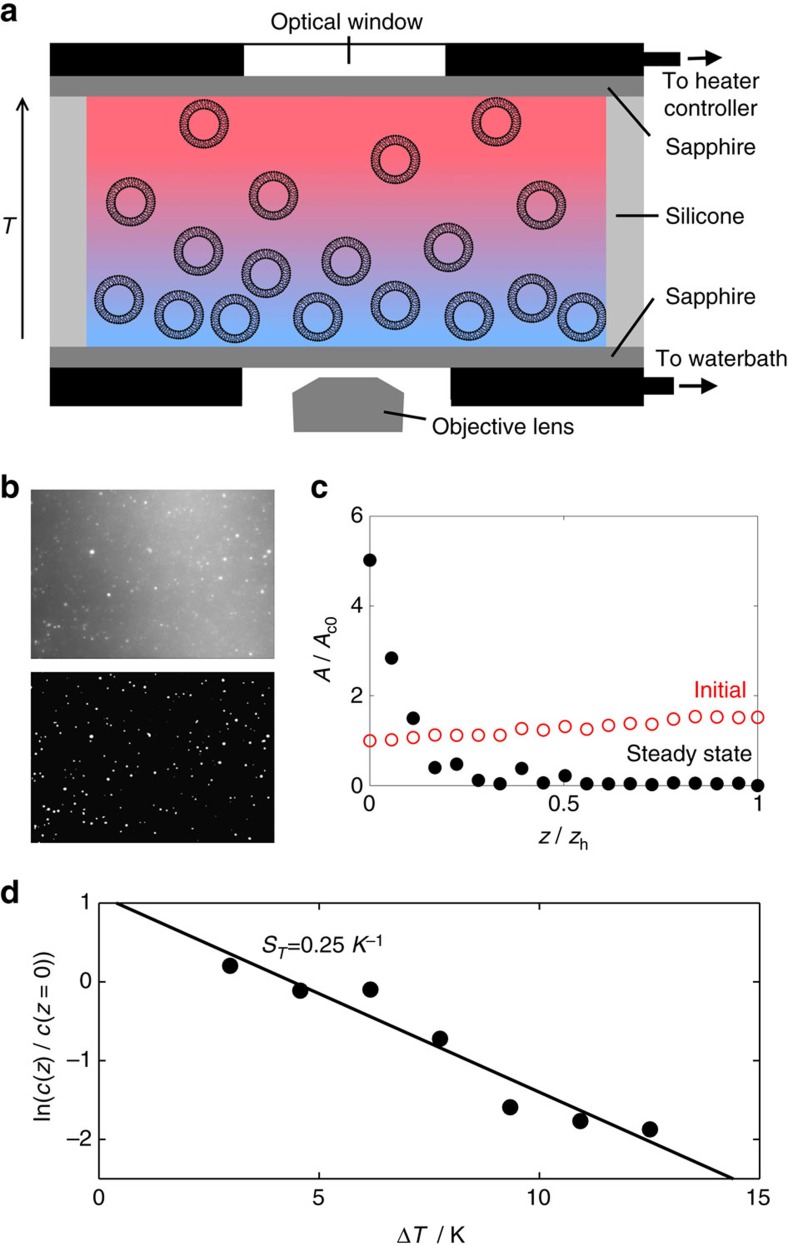
Figure 1. Vesicles respond strongly to thermal gradients.
(a) Schematic cross-section of the custom-made temperature cell with a vertical thermal gradient (heating is from above). In this case, vesicles are thermophobic and move towards the lower (cold) sapphire window. (b) An example of a fluorescence image for a single slice and the corresponding binary conversion result obtained using MATLAB routines. (c) An example of the change in area fraction of vesicles in the slice, A, normalized by the initial area fraction at the cold plate, Ac0, with height, z, above the cold plate (z=0) for thermophobic migration. The height is normalized by that of the hot plate, zh. (d) An example data set (DiPhyPC vesicles with Thot=45 °C and Tcold=15 °C) showing at steady state an exponential concentration gradient with temperature (that is, also height), solid line fit on data, from which the value of the Soret coefficient ST can be obtained as from the relation in equation (2).

