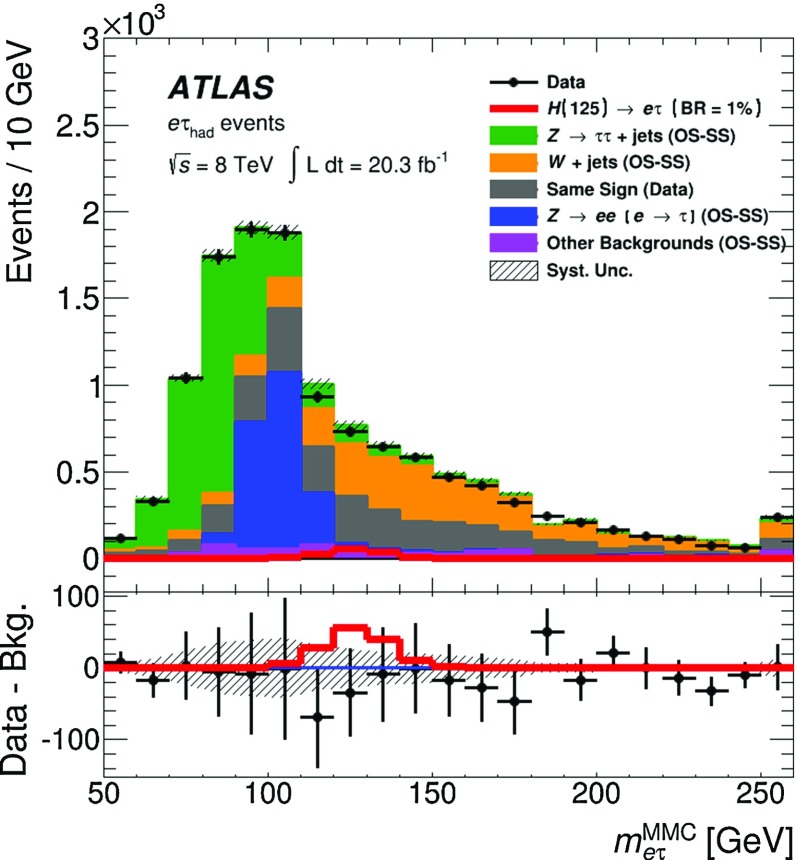
Fig. 3.
Post-fit combined distribution obtained by adding individual distributions in SR1 and SR2. In the lower part of the figure, the data are shown after subtraction of the estimated backgrounds. The grey band in the bottom panel illustrates the post-fit systematic uncertainties in the background prediction. The statistical uncertainties for data and background predictions are added in quadrature in the bottom part of the figure. The signal is shown assuming Br. Very small backgrounds due to single top, , VV, and events are combined in a single background component labelled as “Other Backgrounds”. The last bin of the distribution contains events with 250 GeV

