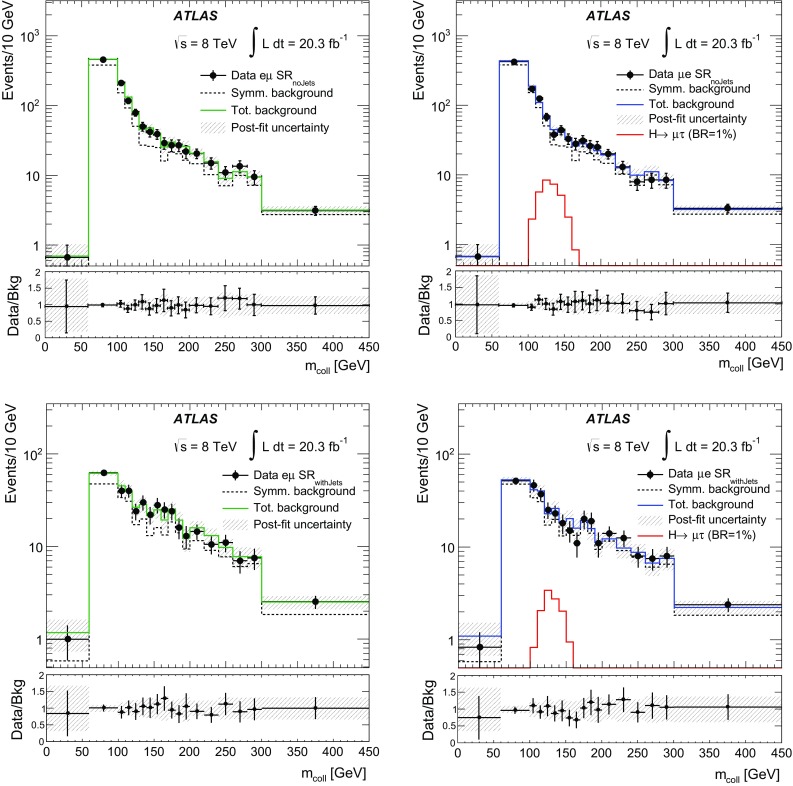
Fig. 4.

Collinear mass distributions in the channel: background estimate compared to the events observed in the data in the (top) and (bottom). Left channel. Right channel. In these plots, events from the three bins are combined, although the fit parameters are different in each bin. The signal expected for a is shown in the channel
