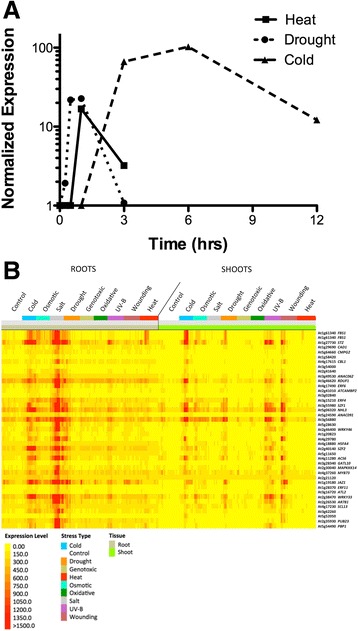
Fig. 1.

Expression profiles of FBS1 and co-expressed genes in abiotic stresses. a Time course analysis of FBS1 expression in AtGenExpress ATH1 array data sets from heat, drought, and cold treated 18 day-old Arabidopsis plants. The average of the two available biological replicates is shown; all time points are normalized to time 0 (untreated). b Thirty-nine genes with expression patterns significantly correlating (r > 0.75) with FBS1 expression. Shown is absolute expression across 272 ATH1 array samples from 16 day-old Arabidopsis roots and shoots that experienced one of nine different abiotic stresses or control conditions. For each treatment, the exposure time for the given stress increases from left to right
