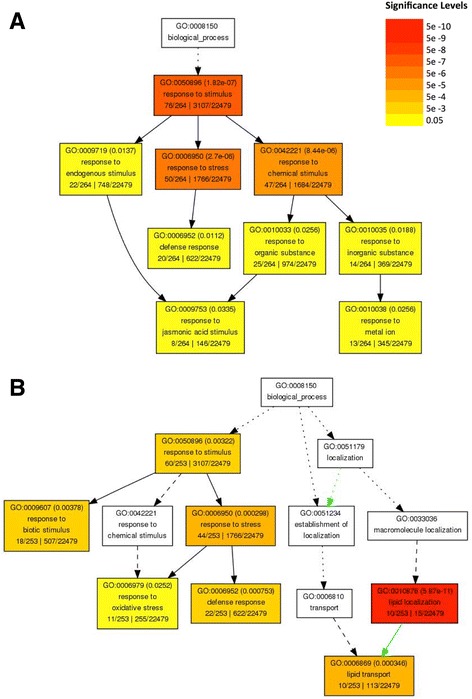
Fig. 2.

Gene Ontology (GO) term enrichment analysis for FBS1-dependent genes. Biological processes significantly enriched for genes with higher expression in WT (a) and genes with higher expression in fbs1–1 seedlings (b) are shown. Each box indicates the GO term and description with the FDR adjusted p-value, and the color scale reflects these adjusted p-values. The fraction on the left side at the bottom is the number of genes in our dataset falling into that GO category out of the total number of genes in the list. The fraction on the right is the total number of genes on the ATH1 array falling into that GO category, out of the total number of genes represented on the array. Boxes with GO terms are presented hierarchically, with the root term at the top and child terms toward the bottom. Solid, dashed, and dotted lines show either two, one, or zero enriched terms at either end of the line; the green line indicates negative regulation
