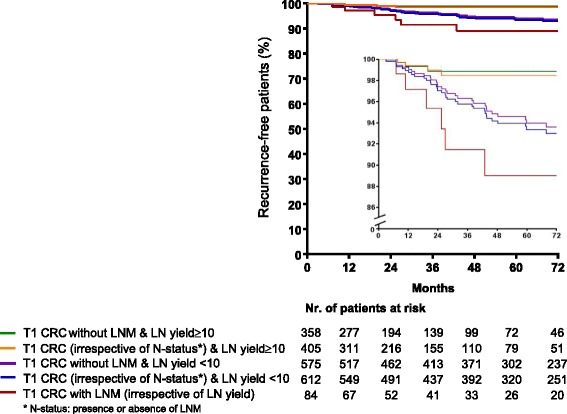
Fig. 3.

Kaplan–Meier curve of percentage of recurrence-free T1 CRC patients in relation to LN yield and presence of LNM. Green line: patients with T1 CRC without LNM and LN yield ≥ 10; orange line: patients with T1 CRC (with and without LNM) and LN yield ≥ 10; purple line: patients with T1 CRC without LNM and LN yield < 10; blue line: patients with T1 CRC (with and without LNM) and LN yield < 10; red line: patients with T1 CRC with LNM (irrespective of LN yield). The inset shows the same data on an enlarged y axis. Abbreviations: CRC: colorectal cancer; LN: lymph node; LNM: lymph node metastasis; nr: number
