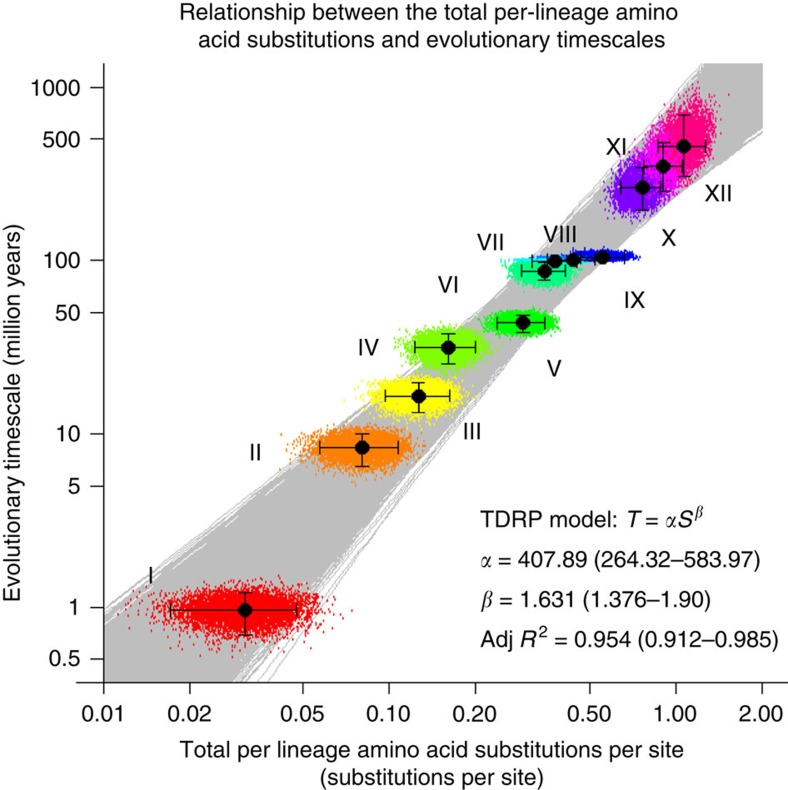
Figure 4. Evolutionary timescale of FLERVs estimated by using the power-law rate-decay model.
The total per-lineage amino acid substitutions (S) from various nodes to the chimpanzee simian FV (U14327 SFVcpz) are plotted against corresponding evolutionary timescales (T). The S and T estimates are labelled with Roman numerals (I–XI), referring to nodes in Fig. 3. Solid black dots are median estimates, and the associated 95% HPDs intervals are indicated by error bars. The T estimates of node I–IX were directly inferred from those of their hosts35,39,40. 7,500 power-law TDRP models were fitted to the posterior distributions of the S and T estimates of the nodes I–IX (grey lines). The median model parameter values, adjusted R2 scores, and corresponding 95% HPDs (in the parentheses) are shown in the bottom right. The model was extrapolated to infer the branching date of lobe-finned fish FLERV lineage (node X), the separation date of salamander FLERV lineage (node XI) and the age of the entire FV/FLERV clade (node XII). See Table 2 for the values.

