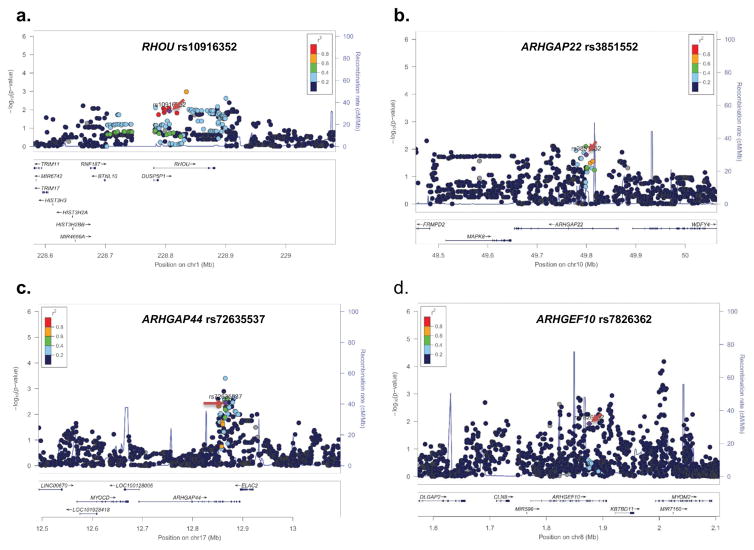
Figure 1.
Regional association plot for the independent SNPs in The University of Texas MD Anderson cancer Center (MDACC) dataset. Single nucleotide polymorphisms (SNPs) in the region of 200 kb up- or down-stream of RHOU rs10916352 (a), ARHGAP22 rs3851552 (b), ARHGAP44 rs72635537 (c), and ARHGEF10 rs7826362 (d). Data points are colored according to the level of linkage disequilibrium (LD) of each pair of SNPs based on the hg19/1000 Genomes European population. The left-hand y-axis shows P values for associations with individual SNPs, which is plotted as −log10 (P) against chromosome base-pair position; the right-hand y-axis shows the recombination rate estimated from HapMap Data Rel 22/phase II European population; the selected SNPs were pointed with the red arrows.

