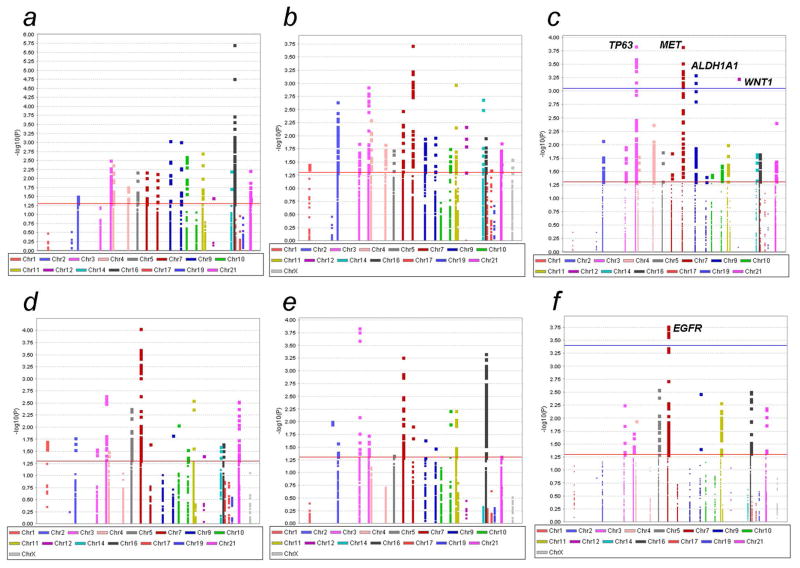
Figure 2.
Manhattan plots of the four studies and the meta-analysis results of the two racial populations. The red horizontal line indicates P = 0.05 and the blue line indicates FDR = 0.2. (a) 6,549 common SNPs from Africans of the Ghana study. (b) 6,267 common SNPs from African descendants of the MEC AA study. (c) The meta-analysis of 5,448 SNPs in two studies of African descendants. (d) 5,239 common SNPs from non-Hispanic whites of the PLCO study. (e) 5,345 common SNPs from non-Hispanic whites of the BPC3 study. (f) The meta-analysis of 4,934 SNPs in two studies of non-Hispanic whites.

