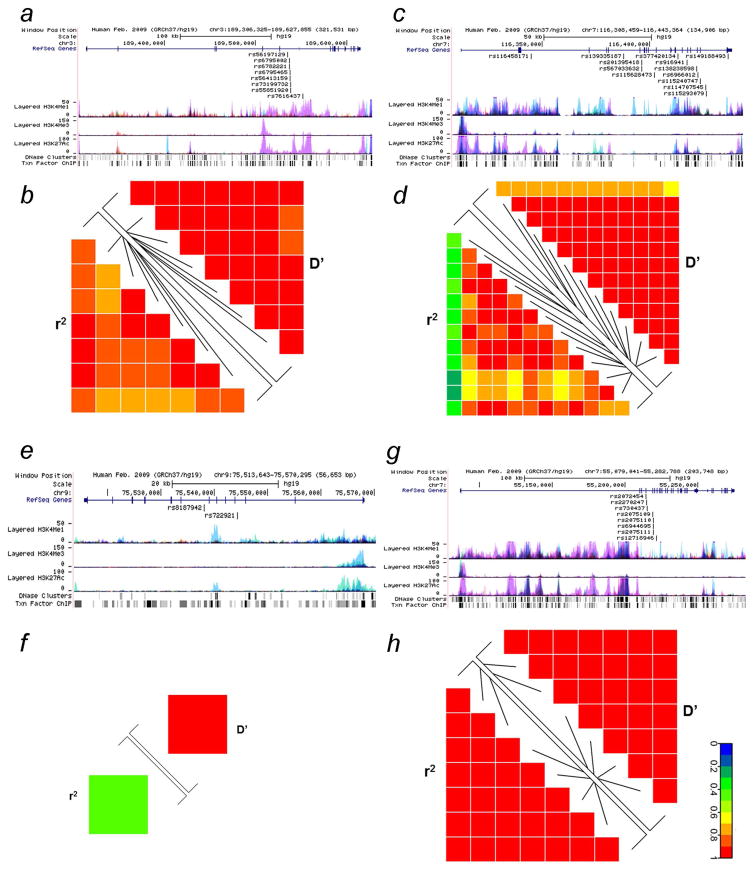
Figure 3.
Overview of the top SNPs in the two racial populations and linkage disequilibrium (LD) analysis based on the 1000 Genomes Project Phase 3 database. Gene regions from the UCSC browser (NCBI37/hg19) (a) TP63, (c) MET, (e) ALDH1A1 and (g) EGFR. LD analysis in Africans: (b) eight SNPs in TP63, (d) 13 SNPs in MET and (f) two SNPs in ALDH1A1. LD analysis in Europeans: (h) eight SNPs in EGFR.

