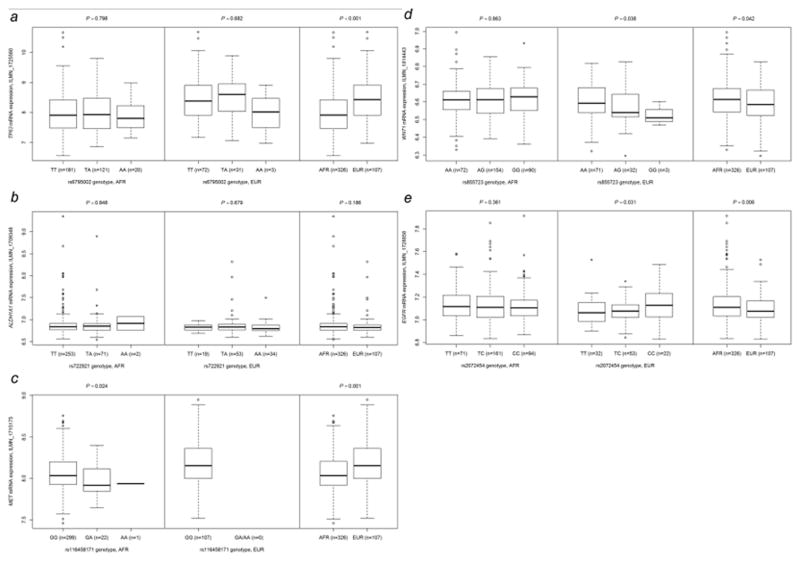
Figure 4.
Correlation between SNPs and the mRNA expression level of corresponding genes in lymphoblastoid cell lines from the HapMap 3 project. Each figure depicts results of each SNP in 326 Africans, 107 Europeans and the comparison of overall expression levels between the two populations: (a) rs6795002 and TP63, (b) rs722921 and ALDH1A1, (c) rs116458171 and MET, (d) rs855723 and WNT1 and (e) rs2072454 and EGFR. Abbreviations: AFR, African; EUR, European.

