
Figure 3.
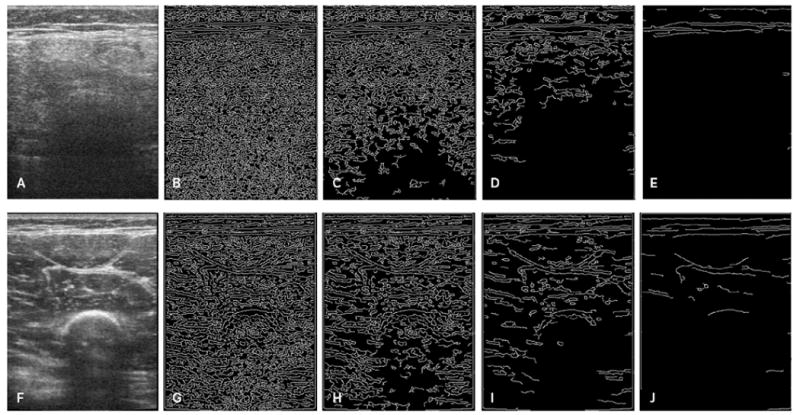
Edge detection and quantification images at different Canny sensitivity thresholds. A and F, Ultrasound images of the quadriceps muscles in a 6-year-old patient with DMD (A) and a 6-year-old control participant (F). Note the increased echo intensity of the muscle in the patient with DMD and poor visualization of the intermuscular fascial bands and bone. The corresponding edge detection images detected at Canny sensitivity thresholds of 0.05 (B and G), 0.10 (C and H), 0.20 (D and I), and 0.40 (E and J) are shown. More edges are detected at the lower thresholds than the higher thresholds in the patient with DMD compared to the control participant.