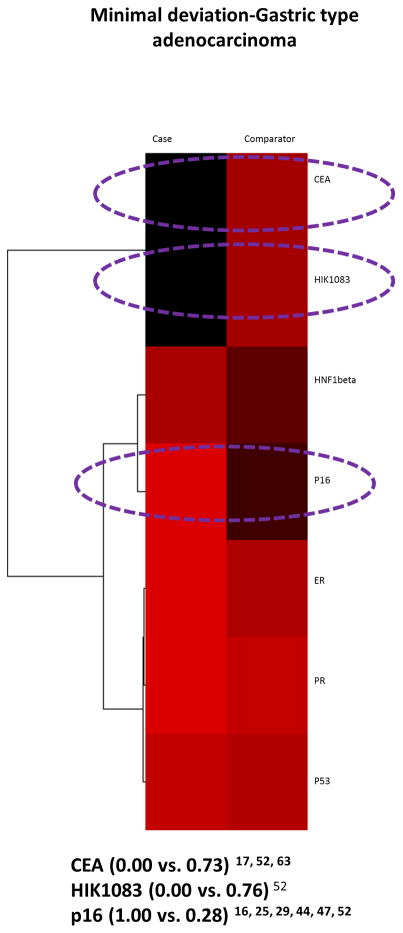
Figure 6.
Serous-Clear cell carcinoma case versus Minimal deviation adenocarcinoma/Gastric type adenocarcinoma comparator: heatmap and dendrogram. Biomarker positivity of 100% is red, 0% is black and percentages in between are shades of these 2 colors. Biomarkers with a positivity difference of 50% or more are circled in purple.

