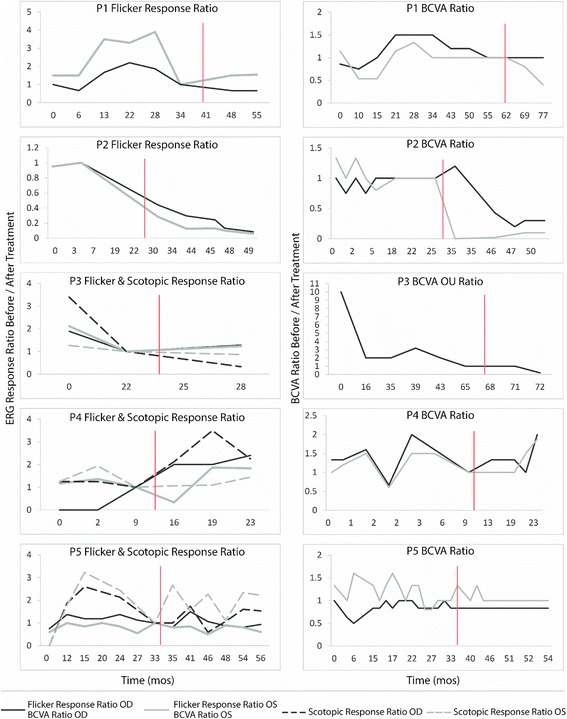
Fig. 2.

ERG/BCVA ratio variation with time. ERG (left) and BCVA (right) ratio comparing response from last appointment before rituximab administration to each subsequent (or previous) appointment (After/Before). Data from P1 is depicted in the top, and each patient’s data sequentially follows. Red line signifies time point of first rituximab administration
