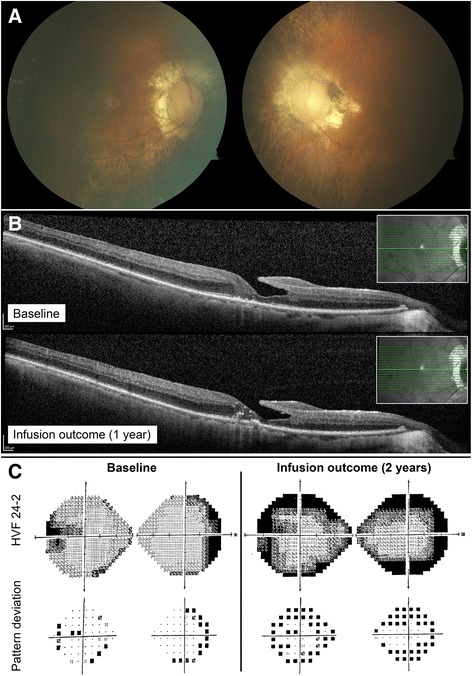
Fig. 4.

P2 imaging and functional assessments. P2 fundus pictures OU (a). OCT line OD showing lamellar hole with cysts in the right eye before starting rituximab (2014, top), which continued to deteriorate on rituximab treatment (2015, bottom) (b). HVF 24–2 OU grey scale and pattern deviation before (2013, left) and after (2015, right) initiation of rituximab (c)
