
Fig. 5.
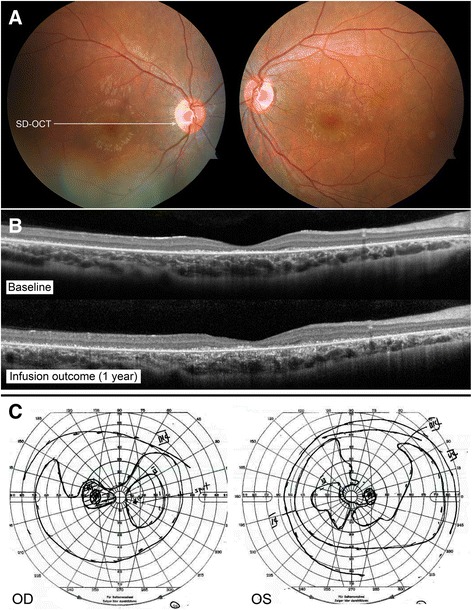
P3 imaging and functional assessments. P3 fundus pictures OU (a). OCT line in OD showing retinal thinning and progression of granular deposits at the EZ line between spring 2015 and end of 2015, after rituximab infusion (top and bottom, respectively) (b). Goldmann visual fields in both eyes at first visit (c)