
Fig. 6.
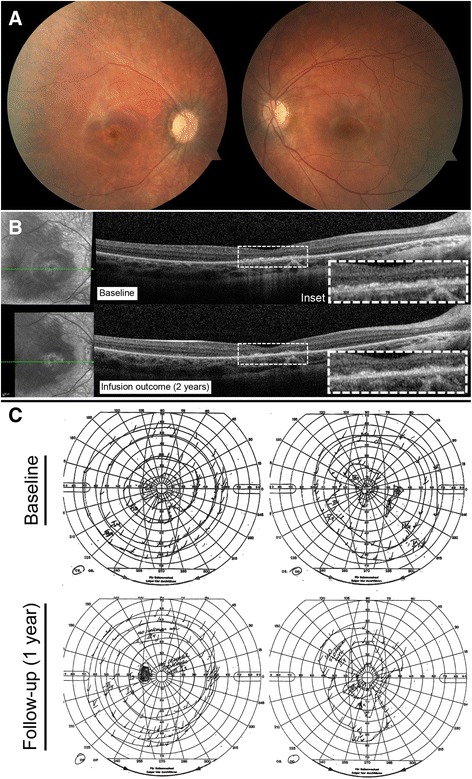
P4 imaging and functional assessments. P4 fundus pictures OU (a). OCT line OD showing loss of EZ line centrally and granular deposition before starting rituximab (2014, top), which changed minimally on rituximab treatment (2016, bottom) (b). Goldmann visual field in both eyes before (2014, top) and after (2015, bottom) initiation of rituximab (c)