
Fig. 7.
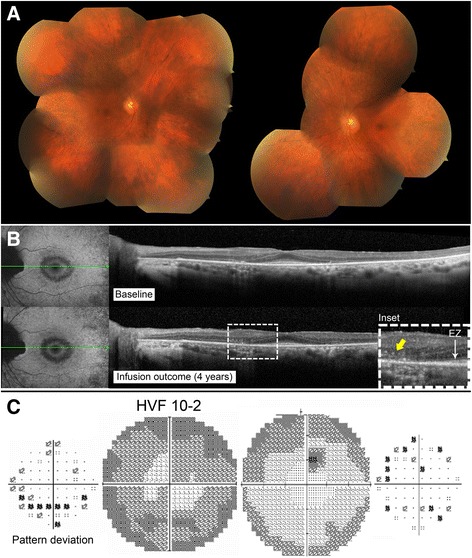
P5 imaging and functional assessments. P5 fundus pictures OU (a). OCT line OD showing stability over many years when comparing OCT at presentation (2011, top) and after rituximab initiation (2015, bottom) (b). Humphrey visual field 24–2 grey scale and pattern deviation OD before (2014, left) and after (2015, right) initiation of rituximab showing mild improvement on overall sensitivity (c)