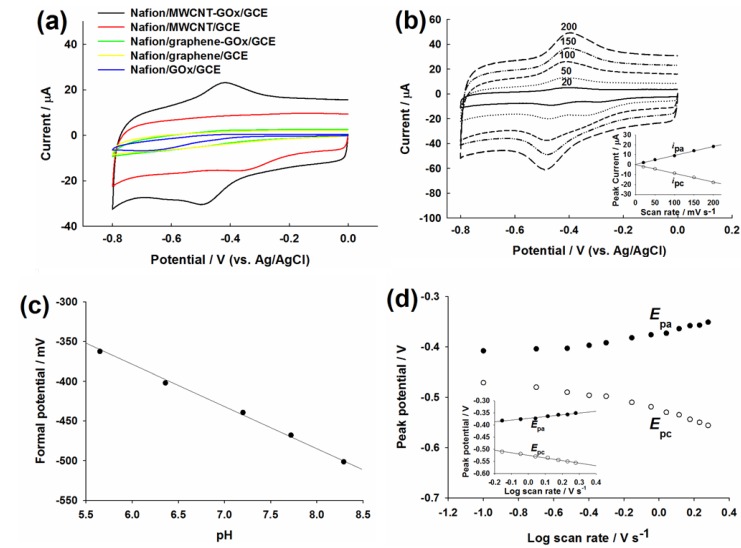
Figure 2.
(a) CVs of Nafion/GOx/glassy carbon electrodes (GCE) (blue), Nafion/graphene/GCE (yellow), Nafion/MWCNT/GCE (red), Nafion/graphene-GOx/GCE (green) and Nafion/MWCNT-GOx/GCE (black) in N2-saturated PBS at 100 mV s−1; (b) The effect of scan rate (20, 50, 100, 150 and 200 mV s−1) on the DET of GOx on Nafion/MWCNT-GOx/GCE in N2-saturated PBS. Inlet: the linear relation between ipc (or ipa) and v; (c) The relation between the formal potential (observed on Nafion/MWCNT-GOx/GCE) and different pH values: 5.65, 6.36, 7.2, 7.72, 8.29. Scan rate = 100 mV s−1; (d) Plot of Ep (of the Nafion/MWCNT-GOx/GCE) vs. log v, v = 0.1, 0.2, 0.3, 0.4, 0.5, 0.7, 0.9, 1.1, 1.3, 1.5, 1.7, 1.9 V s−1. Inlet: the relation between Epa (or Epc) and log v.

